

💥 Investing Insights & Market Analysis [Nov 19, 2025]
EXPLAINED: Warren Buffett buys Google, Michael Burry quits, Bankruptcies surge, Bitcoin crashes, 3 stocks I’m buying $PANW $MELI $META, and much more!

👋 Good morning my friend, I hope you’re having a wonderful week! Thank you for joining 108,000 subscribers who trust this newsletter to get smarter with money, investing, and the economy!
Every issue takes a few days to research and write, so if you enjoy reading, please hit the ❤️ LIKE button on this post to help us grow on Substack (and get a 30-day free trial of our newsletter with this link)
📬 In this issue we discuss:
Part I — Markets & Economy:
(1) This Week's Market & Economic Analysis
(2) Top 3 Finance Events
(3) 3 Important Charts
(4) Economic Outlook & Market Sentiment

Part II — Stocks:
(5) My Stock Picks & Research
(6) Insider Trades from Billionaires, Politicians & CEOs
(7) Top 5 Stocks this Week
(8) Trade of the Week
(9) 5 Stocks to Watch (Earnings this Week)

Part III — Real Estate:
(10) Real Estate Market Analytics
(11) Interest Rate Predictions

Part IV — Marco:
(12) Technical Analysis (S&P 500, Tech, Bitcoin)
(13) 3 Important Events this Week
This issue has so much great advice to help you build wealth, but before we get into it, please help us and:
Hit the ❤️ LIKE button on this post and help us grow on Substack 🙏
Share this newsletter with friends & family to help them get smarter with money, investing, and the economy!
Become a paid subscriber and support our research and writing! (Get a 30-day free trial with this link) (learn about the benefits here)
(1) Market & Economic Analysis (and how it impacts YOU):
Here’s everything important happening:
The stock market is hitting a major speed bump, just as we predicted. If you took some profits and raised cash like we discussed, you’re looking smart right now.
The markets have hit the brakes hard. The S&P 500 dropped for three straight days and fell below a key technical level (its 50-day moving average). Tech stocks got hammered, especially AI companies, as investors started asking: “Are we paying too much for these stocks?” Everyone’s on edge waiting for Nvidia’s earnings report Wednesday, which could either calm fears or confirm them.
Bitcoin crashed below $90,000, wiping out all its gains for the year. Meanwhile, something interesting happened: money started rotating out of expensive tech stocks and into sectors like healthcare, energy, and materials. This shift is so dramatic that it’s the strongest month for these “boring” stocks since March.
Here’s the connection: Uncertainty breeds fear, and fear breeds rotation. We don’t have critical jobs data because of the government shutdown. We don’t know what the Fed will do next. And we’re not sure if AI stocks deserve their sky-high prices. When investors can’t see clearly, they stop taking big risks and start playing defense.
💡Andrew’s Deep Dive & Analysis:
Most people think market crashes come out of nowhere. They don’t.
They come after everyone ignores the warning signs because they’re making too much money to care. In my 20 years in finance, I watched this pattern repeat itself over and over. The party’s going great. The music’s loud. Nobody wants to leave. Then suddenly, someone turns off the lights.
This week, the lights started flickering.
Think of the market like a crowded theater. For months, everyone piled into the same few seats (tech stocks, AI companies, Bitcoin). The front row was packed. People were standing in the aisles. Then someone yelled “Fire!” and everyone rushed for the exits at once.
The S&P 500 didn’t just fall. It broke through its 50-day moving average, which is Wall Street’s way of saying “the short-term trend just turned negative.” Tech stocks, which had been the market’s darlings, suddenly became its biggest losers. Bitcoin, which had been partying above $100,000, face-planted and erased an entire year of gains.
But here’s what’s fascinating: while everyone was running out of the “tech theater”, they weren’t going home. They were moving to a different show. Healthcare stocks rose. Energy companies climbed. Materials stocks (the companies that make actual stuff) outperformed. The S&P 500 Equal Weight Index (which treats every stock the same, not just the big tech giants) is having its best month since March.
This isn’t a crash. This is a rotation. And rotations tell you something critical about what investors really think.
Pattern #1: The Certainty Premium is Gone
For the past year, investors paid premium prices for stocks they thought were “sure things.” Nvidia was printing money from AI chips. Bitcoin was the digital gold everyone needed. Tech stocks were the future. But certainty is expensive, and when doubt creeps in, those premium prices evaporate fast.
The government shutdown delayed jobs data. The Fed’s next move is unclear. Nvidia’s earnings could disappoint. Suddenly, nothing feels certain anymore. When the future gets foggy, people stop paying luxury prices for it.
Pattern #2: Fear of Missing Out Becomes Fear of Losing Everything
(This is where psychology takes over.) When Bitcoin was climbing, people bought because they were scared of missing out. Now it’s down 27% from its peak, and those same people are selling because they’re scared of losing more. The emotional pendulum swung from greed to fear. And when emotions drive decisions, logic walks out the door.
Pattern #3: Smart Money Moves Before the Crowd
While retail investors were still piling into AI stocks, institutional money started rotating into defensive sectors. Healthcare doesn’t depend on Nvidia’s earnings. Energy companies benefit when uncertainty rises. Materials stocks are cheap compared to tech. The pros aren’t leaving the market. They’re just changing seats.
This rotation isn’t random. It’s telling you that big money managers think: (1) tech valuations got too high, (2) other sectors offer better value, and (3) we’re entering a period where safety matters more than growth.
What History Teaches Us
Warren Buffett has a famous line: “Be fearful when others are greedy, and greedy when others are fearful.” But there’s a middle stage nobody talks about—the transition. Right now, we’re in that messy middle. Greed is fading. Fear hasn’t fully arrived. And that’s actually when the smartest moves happen.
Think back to late 1999. Tech stocks were soaring. Everyone was convinced the internet would make them rich. Then the party ended, and the Nasdaq crashed 78% over the next two years. But here’s what people forget: the crash didn’t happen all at once. It started with small cracks, just like we’re seeing now. Stocks breaking technical levels. Bitcoin pulling back. Money rotating to defensive sectors.
The people who protected their wealth weren’t the ones who predicted the exact top. They were the ones who noticed when the momentum shifted and adjusted their exposure before everyone else panicked.
What the Nvidia Earnings Mean
Everyone’s focused on Wednesday’s Nvidia earnings, but here’s what most people miss: The number doesn’t matter as much as the reaction.
If Nvidia crushes expectations and the stock still falls, that tells you valuations are the problem, not the business. If Nvidia misses and the stock rallies, that tells you expectations got too pessimistic. Either way, watch what the market does, not just what Nvidia reports.
And here’s the contrarian angle: The best time to buy quality companies is often when everyone’s freaking out about earnings. Not before. Not during. But after, when the dust settles and you can see clearly.
The Long-Term:
Implication #1: AI is Real, But the Hype Cycle Was Overcooked
This pullback doesn’t mean AI isn’t revolutionary. It means investors got ahead of themselves. (We do this every time. Internet stocks in 1999. Housing in 2006. Crypto in 2021.) The technology will change the world. Most of the companies won’t survive. Five years from now, AI will be embedded in everything, but many of today’s AI darlings will be forgotten. The winners will be companies that use AI to cut costs and boost profits, not the ones that just talk about it.
Implication #2: Diversification is Making a Comeback
For years, diversification felt like a mistake. Why own boring energy stocks when tech was up 40%? This rotation reminds us why: because you never know when the music stops. The next decade will reward investors who spread their bets across sectors, not the ones who go all-in on whatever’s hot.
Implication #3: Volatility is the New Normal
Between geopolitical tensions, Fed uncertainty, and stretched valuations, expect more weeks like this one. The smooth ride is over. Markets will swing harder and faster. The investors who win will be the ones who plan for chaos instead of hoping for calm.
What to Do
Framework #1: The 60-20-20 Portfolio Reset
Here’s a system you can implement:
30-50% in the “boring stuff”: Healthcare, consumer staples, utilities, dividend stocks. These won’t make you rich quick, but they won’t crater when tech pulls back. Think Johnson & Johnson, Procter & Gamble, NextEra Energy.
10-30% in the “calculated risks”: Keep some exposure to tech and AI, but be selective. Look for companies with actual profits (Microsoft, Google) instead of pure-play speculative AI stocks. You want companies using AI to make money, not just promising to make money someday.
10-30% in cash: (This is the most important part.) Cash feels stupid when stocks are rising, but it’s your ammunition when opportunities appear. Right now, with tech pulling back and uncertainty high, having cash means you can buy quality assets when they go on sale.
Why it works: This framework protects you when markets fall (the 30-50% in “boring stuff” and 10-30% cash) while still giving you upside when things recover (the 10-30% in growth). It’s not exciting, but excitement is overrated when your retirement is on the line.
Framework #2: The Conviction Test
Before buying (or holding) any stock right now, ask yourself three questions:
Would I buy more if it dropped 20% tomorrow? (If the answer is no, you don’t believe in it enough. Sell.)
Can I explain in one sentence why this company will make more money in 5 years? (If you can’t, you don’t understand it. Don’t invest in what you don’t understand.)
Am I buying because of fundamentals or because everyone else is? (Be honest. FOMO is not an investment strategy.)
How to implement: Go through your portfolio. Run each position through these three questions.
Framework #3: The Dollar-Cost Average on Quality
Here’s what smart money is doing right now: They’re building shopping lists. They’re identifying high-quality companies they want to own and setting price targets. Then, when those stocks pull back to reasonable valuations, they buy in small increments.
Step-by-step:
Make a list of 5-10 companies you’d love to own at the right price
Determine what “the right price” is (usually 15-20% below current levels)
Set alerts for when stocks hit those levels
When they do, buy in small chunks (not all at once)
If they keep falling, keep buying (dollar-cost averaging)
Why it works: You’re not trying to catch the exact bottom. You’re taking advantage of fear and volatility to build positions in great companies at good prices.
Mistakes to Avoid
Red Flag #1: Thinking “This Time is Different”
Every bubble convinces people that old rules don’t apply. “The internet changes everything.” “Housing never goes down.” “AI is revolutionary.” (AI is revolutionary, but that doesn’t mean you should pay any price for AI stocks.) Innovation doesn’t suspend the laws of valuation.
Red Flag #2: Panic Selling Everything
The opposite mistake is just as bad. Selling all your stocks because of one rough week turns temporary losses into permanent ones. The goal isn’t to avoid every pullback. It’s to position yourself so pullbacks don’t devastate you.
Red Flag #3: Ignoring Sector Rotation
When money moves from tech to healthcare, it’s not random. It’s telling you something about risk appetite and valuations. Pay attention. The market is always giving you clues. Most people just don’t listen.
Important Lessons
Lesson #1: Greed and Fear Drive Everything
Markets aren’t rational. They’re emotional. People bought Bitcoin at $120,000 because they were greedy. Now they’re selling at $90,000 because they’re scared. The fundamentals barely changed. The emotions did. If you can control your emotions while others can’t, you have an enormous advantage.
Lesson #2: Concentration Builds Wealth, Diversification Protects It
You can get rich by going all-in on the right stock at the right time. But you stay rich by spreading your bets. Most people spend their lives trying to get rich again because they never learned to protect what they built.
Lesson #3: Cash is Not Trash
In bull markets, everyone mocks cash. “Why hold cash when stocks are up 20%?” Here’s why: because opportunities come in bunches, and you can’t buy them if you’re fully invested. Cash is optionality. Cash is ammunition. Cash is freedom.
The Truth
Here’s what I’ve learned after 15 years in finance: Market corrections don’t destroy wealth. They redistribute it. Money moves from people who bought at the top to people who bought the dip. From people who panicked to people who stayed disciplined. From people who chased hype to people who focused on fundamentals.
This week’s pullback isn’t the end of the bull market. But it might be the end of the easy part. The next phase rewards different behaviors. Less speculation. More selectivity. Less concentration. More diversification. Less hope. More planning.
The stock market is the only place where things go on sale and people run away scared. (Think about that for a second.) When your favorite store has a 20% off sale, you rush in to buy. When quality stocks drop 20%, most people panic and sell. The people who build lasting wealth are the ones who do the opposite.
Advice
Take inventory: What percentage of your portfolio is in tech? In AI stocks? In crypto? If the answer makes you uncomfortable, you already know what to do.
Raise some cash: Sell the positions you’re least confident in. Target 15-20% cash. Yes, you might miss some upside if the market rallies. You’ll also dodge some bullets if it doesn’t.
Build your shopping list: Which high-quality stocks do you wish you owned? Write them down. Set price alerts. Be ready to buy when fear peaks.
Stop checking your portfolio daily: Seriously. Volatility is going to increase. Watching every tick will drive you crazy and make you do stupid things. Check weekly, not daily.
Focus on what you can control: You can’t control what Nvidia reports or what the Fed does. You can control your allocation, your risk exposure, and your emotional reactions. That’s where the real power is.
Final Thought
You’ve been reading this newsletter long enough to know: we saw this coming. We told you to take profits. We told you to raise cash. Not because we’re geniuses, but because we pay attention to what the market is telling us.
The market always sends signals before it moves. Valuations stretched too high. Sentiment got too bullish. Everyone piled into the same trades. These aren’t magic predictions. They’re patterns that repeat throughout history.
The question isn’t whether you’ll face more volatility. You will. The question is whether you’ll be prepared for it. Whether you’ll have cash to deploy. Whether you’ll stay calm while others panic. Whether you’ll see opportunity where others see catastrophe.
That’s what separates the investors who build wealth from the ones who just talk about it.
The market just gave you a warning shot. What you do next will determine how the rest of this year goes for your portfolio.
👉 For daily insights, follow me on X /Twitter; Instagram Threads; Facebook; or BlueSky, and turn on notifications!
(2) Top 3 Finance Events (and what it means for you):
In this issue we analyze:

(1) Warren Buffett’s Berkshire Hathaway announces it has purchased a $4.3 billion stake in Alphabet.

(2) Michael Burry announces that his hedge fund is shutting down.

(3) Why is bitcoin dropping?

(4) Final thought - What these events teach us
🤔 How do you feel about the markets this week?
1️⃣ Warren Buffett’s Berkshire Hathaway announces it has purchased a $4.3 billion stake in Alphabet
If you’ve been buying Alphabet as we’ve been recommending in the stock picks section of this newsletter, you’re looking smart right now.
Berkshire Hathaway purchased $4.3 billion worth of Alphabet stock in the third quarter, making Google’s parent company Berkshire’s 10th-largest holding. This marks the first time the 95-year-old investing legend has ever bought shares in Google, despite admitting for years that he “blew it” by not investing earlier.
This move is especially interesting because Buffett is expected to step down as CEO before the new year, marking the end of a six-decade run that transformed Berkshire from a failing textile mill into a trillion-dollar empire.
What It Means
This is the most contrarian move Buffett’s made in years. And if you understand why, you’ll understand something critical about where value is hiding right now.
For months, everyone feared that AI chatbots would destroy Google’s Search business. People thought ChatGPT and other AI tools would replace Google as the place you go for answers. That fear pushed Alphabet’s stock down to just 20 times earnings at the start of the year, making it the cheapest of the “Magnificent Seven” tech stocks.
Then something fascinating happened. In the second quarter, Google’s paid clicks (the number of times people clicked on ads) actually accelerated, growing 4% instead of slowing down like everyone expected. By the third quarter, that growth hit 7%. This wasn’t just a blip. It was proof that Google could adapt to the AI era instead of being destroyed by it.
Here’s what Buffett saw: Google introduced something called “AI mode” in May, which basically puts a chatbot experience inside Google Search. Instead of losing users to ChatGPT, Google gave people the AI experience they wanted while keeping them in the Google ecosystem. And it worked.
Think about what this means. You’ve got billions of people who wake up and type things into Google every single day. That’s a habit that’s been building for 25 years. Now imagine trying to convince all those people to go somewhere else. It’s like trying to convince everyone to stop using their iPhone and switch to a different phone. The switching costs are massive, and the habit is deeply ingrained.
Buffett isn’t just betting on Google. He’s betting against the AI panic. Everyone got so scared that AI would destroy established tech companies that they forgot to ask a simple question: What if the companies with billions of users and unlimited resources just integrate AI into what they already do?
That’s exactly what’s happening. And Buffett, who’s spent 60 years finding value where others see fear, spotted it.
This purchase tells you three things about the next five years:
First, the AI revolution won’t kill the incumbents. Microsoft, Google, Amazon—these companies have too much distribution, too much data, and too much money to lose. They’ll integrate AI into their products and maintain their dominance. The real losers will be the AI-only startups trying to compete without any existing user base.
Second, valuations matter again. For years, people paid any price for growth. Buffett’s Alphabet purchase at 28 times earnings (still reasonable for a growing tech giant) signals that the era of “growth at any price” is over. The next decade belongs to companies that combine growth with reasonable valuations.
Third, distribution beats technology. Google didn’t invent the best AI. (That’s probably OpenAI or Anthropic.) But Google has 8 billion daily users. In the long run, distribution wins. This applies to every sector: the company that gets its product in front of the most people, even with slightly inferior technology, beats the company with better technology but no distribution.

What To Do
The “Follow the Oracle” Strategy: When the world’s greatest investor makes a big bet after avoiding something for decades, pay attention. But don’t just copy the trade. Learn the principle.
Buffett bought Alphabet because:
Everyone feared the worst (AI destroying Search)
The fear pushed the price down to reasonable levels
The company proved the fears were overblown
The valuation became attractive relative to growth
Advice:
Make a list of quality companies that got beaten down by AI fears
Look for proof points (like Google’s accelerating clicks) that the fears were exaggerated
Buy when the price makes sense, like Buffett did
2️⃣ Michael Burry announces that his hedge fund is shutting down.
Michael Burry, the famous “Big Short” investor who made $700 million betting against the housing market in 2008, is shutting down Scion Asset Management at the end of the year. In a letter to investors dated October 27, Burry wrote: “My estimation of value in securities is not now, and has not been for some time, in sync with the markets.”
Before closing shop, Burry launched a social media attack on AI stocks, claiming tech giants like Meta and Oracle are using accounting tricks to artificially boost their earnings by understating depreciation on their AI infrastructure. He estimated these companies could be overstating their profits by 21% to 27% by 2028.
Burry also revealed he’s betting against Nvidia and Palantir using put options, which increase in value when stock prices fall. Palantir’s CEO responded by calling Burry “bats—crazy.” (When billionaires start publicly insulting each other, you know something’s brewing.)
What It Means
When one of the greatest market skeptics in history closes his fund because valuations make no sense, you should probably listen.
In my 20 years working in finance, I’ve seen this pattern before. Smart investors don’t close their funds when they’re wrong. They close them when staying in the game means compromising their principles or losing their clients’ money in a market that’s become untethered from reality.
Burry isn’t saying the market will crash tomorrow. He’s saying the relationship between price and value has broken down so completely that he can’t operate effectively anymore. That’s different. And arguably more dangerous.
Here’s his core argument, and it’s worth understanding: Tech companies are spending hundreds of billions on AI chips and servers. Normally, you’d depreciate (write off) that equipment over maybe 3-4 years because technology becomes obsolete quickly. But many companies are stretching those depreciation schedules to 5, 6, even 7 years. This makes their current earnings look better because they’re spreading the costs out over more time.
Think of it like buying a car. If you could magically decide the car lasts 20 years instead of 10, you’d only have to account for half the cost each year on your books. Your expenses would look lower. Your profits would look higher. But the car still might fall apart in 10 years.
Burry’s saying tech companies are doing this with AI equipment, and by 2028, this accounting fiction could be hiding $176 billion in real costs. If he’s right, the AI boom’s profitability is partly an illusion.
But here’s what’s even more interesting: Burry’s also betting against Palantir, which is trading at insane valuations (over $420 billion market cap with limited profits). He bought put options that let him sell the stock at $50 in 2027. The stock’s currently at $178. That’s not a small disagreement. That’s Burry betting Palantir will lose 70% of its value.
The Long-Term
Burry’s move tells you three uncomfortable truths:
First, we’re in the late stages of a speculative bubble. Not necessarily the last inning, but definitely the 7th or 8th. When famous short sellers like Burry, Jim Chanos, and Hindenburg Research all shut down or struggle because the market keeps going up despite fundamentals, that’s a sign the market has entered what I call the “insanity phase.” This is when prices become completely disconnected from underlying business performance.
Second, the accounting games always get exposed eventually. If Burry’s right about depreciation manipulation, there will be a reckoning when those AI assets need to be replaced or written down. Companies can manipulate earnings in the short term, but cash flow doesn’t lie. Eventually, you have to spend the money to replace equipment, and that’s when the truth comes out.
Third, the contrarians might be early but they’re rarely wrong. Burry was “wrong” about housing for two years before being spectacularly right in 2008. He was mocked. His investors revolted. Then he made them a fortune. The market can stay irrational longer than you can stay solvent, but it doesn’t stay irrational forever.
What To Do
The “Prepare Don’t Predict” Framework: You don’t need to short the market like Burry to protect yourself. You just need to build a portfolio that doesn’t blow up when reality catches up to prices.
Step 1: Check your exposure to “faith-based” valuations Go through your portfolio. How much is in companies trading at extreme multiples with limited profits? Companies like Palantir, many AI startups, unprofitable tech stocks? If these companies would need to grow earnings 500% just to justify their current prices, that’s a faith-based investment.
Step 2: Run the “Burry Depreciation Test” For your tech holdings, look at their depreciation schedules. (It’s in the annual reports under “Property and Equipment” notes.) Are they depreciating AI equipment over 6+ years? That’s a red flag that earnings might be artificially boosted.
Step 3: Build a “What if Burry’s right?” hedge You don’t have to short stocks. Instead:
Keep 15-25% in cash or short-term Treasury bonds
Own some value stocks trading at low multiples (under 15x earnings)
Have positions in assets that do well when bubbles pop (gold, defensive stocks, companies with actual cash flow)
Stop asking “Will Burry be right?” Start asking “Can I survive if he’s right?” That’s how professionals think about risk.
3️⃣ Why is bitcoin dropping?
Bitcoin crashed from $126,000 in early October to below $90,000 by mid-November, erasing all its gains for the year. Bitcoin is now down 27% from its peak.
The sell-off accelerated when short-term holders, who bought Bitcoin in the past three months, panic-sold 148,241 BTC at an average price of $96,853, well below what they paid ($102,000 to $107,000). This wasn’t profit-taking. This was a mass capitulation event.
Adding fuel to the fire, rumors spread that Michael Saylor’s Strategy (the largest corporate holder of Bitcoin with over 640,000 BTC) might have sold some of its holdings. Although Saylor denied this on CNBC, saying the company is actually accelerating purchases, the fear alone drove prices lower.
Three factors are driving the decline: a broader tech sell-off as investors question AI valuations, waning liquidity in crypto markets, and concerns that the Federal Reserve might not cut interest rates in December.
What It Means
Bitcoin just demonstrated why it’s still a risk asset. And understanding this distinction could save you from making the same mistake millions just made.
Here’s what happened: For months, people bought Bitcoin because of FOMO (fear of missing out). It was climbing toward $130,000. Everyone thought it would hit $150,000, then $200,000. The narrative was that Bitcoin is “digital gold” and a hedge against everything.
Then the music stopped.
When tech stocks started falling and AI valuations came under pressure, Bitcoin didn’t act like gold. Gold stayed relatively stable. Bitcoin fell. Why? Because Bitcoin isn’t a safe haven yet. It’s a leveraged bet on risk appetite. When investors want to take risks, Bitcoin soars. When they get scared, Bitcoin crashes.
Here’s the psychology: Short-term holders (people who bought in the last 3 months) are the weak hands. They bought near the top because prices were going up, not because they understand Bitcoin’s fundamentals. When Bitcoin broke below $100,000, a level they thought was “support,” they panicked and sold at a loss. This created a cascade: more selling pushed prices lower, triggering more panic, causing more selling.
Meanwhile, long-term holders (people who’ve owned Bitcoin for years) did take some profits since September, but their selling was measured. They weren’t panicking. They were cashing in gains. The crash was driven by short-term speculators, not long-term believers.
And here’s what connects to the broader market: Bitcoin’s correlation with tech stocks, especially AI stocks, has increased dramatically. Bernstein analyst Gautam Chhugani pointed out that many investors who own Nvidia and other AI stocks also hold Bitcoin. When they need to raise cash or reduce risk, they sell both.
The Long-Term
Bitcoin’s crash teaches you three important lessons:
First, narratives change faster than fundamentals. Six weeks ago, Bitcoin was “digital gold” and an inflation hedge. Today, it’s a tech-adjacent speculative asset. The token didn’t change. The story people told themselves changed. This happens in every market cycle. The narrative that drove prices up becomes the narrative that everyone abandons on the way down.
Second, price doesn’t equal adoption. Bitcoin’s price fell, but the underlying technology, network security, and transaction volume remain strong. The fundamentals haven’t changed. The sentiment has. This is actually when smart long-term investors add to positions, not when prices are hitting all-time highs.
Third, leverage and weak hands create opportunity. CryptoQuant noted that this short-term holder capitulation is historically what happens before the next major leg higher. When weak hands sell to strong hands, that’s the transfer of wealth from people who don’t understand what they own to people who do.
But here’s the uncomfortable truth: If you don’t understand why you own Bitcoin, you’re a weak hand. And weak hands always get shaken out.
What To Do
The “Only What You Understand” Rule:
Before buying (or continuing to hold) Bitcoin, answer these questions honestly:
Do I understand the technology? (Not just “blockchain” but actual Bitcoin mechanics)
Can I explain my investment thesis in one sentence? (If not, you don’t have one)
Would I buy more if it dropped another 30%? (If no, you don’t believe in it enough to own it)
If you can’t answer all three confidently, you shouldn’t own Bitcoin.
The Dollar-Cost Average Strategy (If you believe in Bitcoin long-term):
Don’t try to catch the bottom. Instead:
Set aside a fixed dollar amount you’re comfortable losing short-term
Buy the same amount every week regardless of price
Don’t check the price daily (it’ll drive you crazy and make you sell at the bottom)
Only invest what you can afford to have drop 50% without panicking
Why it works: This removes emotion from the equation. You’re not trying to time the market. You’re building a position over time, averaging out the volatility.
The Portfolio Allocation Framework:
5-20% of your portfolio in Bitcoin if you’re aggressive
2-7% if you’re moderate
1-3% if you can’t stomach watching it drop 30-60%
The people who make money in Bitcoin are the ones who buy when everyone’s scared and hold through multiple boom-bust cycles. Not the ones who chase prices and panic sell at bottoms.

4️⃣ Final thoughts - what these events teach us
Here’s what these three events are telling us: We’re at an inflection point where value and speculation are splitting apart.
Think of it as a tug-of-war. On one side, you have Warren Buffett buying value (Alphabet at reasonable prices with proven business models and real cash flow). On the other side, you have Michael Burry shutting down because speculation has overwhelmed fundamentals. And in the middle, you have Bitcoin crashing as the speculative fever breaks.
The Pattern
Pattern #1: The End of the “Everything Rally”
For three years, everything went up. Stocks, crypto, real estate, art, collectibles. The rising tide lifted all boats. Now the tide’s going out, and we’re seeing who’s been swimming naked (as Buffett would say). Quality assets like Alphabet are holding up or even attracting new buyers. Speculative assets like overleveraged crypto positions and overvalued AI stocks are getting crushed.
Pattern #2: Accounting Games and Valuation Tricks Are Being Questioned
Burry’s pointing out that tech companies are using creative accounting to make earnings look better than reality. Short-term Bitcoin holders bought based on momentum, not fundamentals. When you strip away the accounting tricks and the narrative games, what are these assets really worth? That’s the question everyone’s starting to ask.
Pattern #3: Smart Money Is Rotating, Not Exiting
Buffett didn’t go to cash. He rotated into value. Long-term Bitcoin holders didn’t panic. They took measured profits. The professionals aren’t leaving the market. They’re moving from expensive, speculative assets to cheaper, higher-quality assets. This is what market rotations look like in real time.
Pattern #4: Weak Hands Are Getting Shaken Out
Short-term Bitcoin holders capitulating. Retail investors panicking about tech stocks. People selling because prices are falling, not because fundamentals changed. This is the market doing what it always does: transferring wealth from the impatient to the patient, from the emotional to the rational.
The Lesson
Every market cycle has this phase. In 1999, it was the dot-com bubble where valuations stopped mattering until suddenly they did. In 2007, it was subprime mortgages where everyone ignored risk until Burry and others proved the emperor had no clothes. In 2021, it was meme stocks and NFTs where speculation went parabolic before crashing.
We’re in that phase now. The difference between the people who build wealth and the people who lose it comes down to one thing: Do you have the discipline to sell speculation and buy value before everyone else figures it out?
What to Do
Framework #1: The Value-Speculation Spectrum Audit
Step 1: Look at every investment you own.
Step 2: Put each one on this spectrum:
Pure Value: Proven business, reasonable valuation, real cash flow (Buffett’s Alphabet)
Growth with Value: Growing business, stretched but not insane valuation, path to profitability
Speculation: High valuation, limited profits, success depends on future promises
Step 3: Add up what percentage of your portfolio is in each bucket.
Target allocation:
50-60% Pure Value
25-35% Growth with Value
10-15% Speculation (Only money you can afford to lose)
If your Speculation bucket is above 30%, you’re taking more risk than you realize. Start trimming.
Framework #2: The “What’s My Margin of Safety?” Test
This is straight from Buffett’s playbook. For every stock you own, ask:
“If this company’s earnings dropped 30% tomorrow, would the stock price still make sense?”
If yes, you have a margin of safety. Hold.
If no, you’re paying for perfection. Perfection never happens. Sell.
Example: Alphabet at 28x earnings could handle an earnings drop and still be reasonably valued. That’s the difference between a Buffett pick and a speculation.
Framework #3: The Crisis Fund Strategy
Here’s what smart money is doing that you should copy:
Build a 15-30% cash position now.
Why? Three reasons:
Defense: If Burry’s right and valuations crash, you don’t have to sell at the bottom
Offense: When quality assets go on sale (like Alphabet did), you can buy
Peace of mind: You can sleep at night knowing you’re not fully exposed
How to build it:
Sell your weakest positions first (the ones that failed the margin of safety test)
Trim positions that have run up (take profits)
Put the cash in a high-yield savings account or short-term Treasury bills (you’ll earn 4-5% while waiting)
Mistakes That Will Cost You
Believing “This Time Is Different”
Every bubble convinces people the old rules don’t apply. “The internet changes everything” (1999). “Housing never goes down” (2007). “AI is revolutionary so valuations don’t matter” (2025).
AI is revolutionary. That doesn’t mean you should pay any price. Innovation doesn’t suspend the laws of valuation. Burry’s pointing this out, and history suggests he’s probably early, not wrong.
Why This Matters
1999-2000: Everyone bought overvalued tech stocks. Warren Buffett refused to participate, saying valuations made no sense. People mocked him. “The Oracle has lost his touch,” they said. Then the dot-com crash happened. The Nasdaq fell 78%. Buffett was right. The people who preserved capital and bought quality businesses during the crash built generational wealth.
2007-2008: Everyone thought housing prices would go up forever. Michael Burry said the subprime mortgages were toxic and would blow up. People called him crazy. His investors tried to pull their money. Then the financial crisis happened. Burry made $700 million for his clients. The people who listened to him (or thought like him) protected their wealth.
2025: Everyone’s betting on AI stocks at any price. Bitcoin hit $126,000 on pure speculation. Buffett’s buying value. Burry’s closing his fund because speculation overwhelms fundamentals. History doesn’t repeat, but it rhymes.
The people who build lasting wealth in the next five years won’t be the ones chasing AI stocks at 150x earnings or buying Bitcoin at all-time highs. They’ll be the ones who rotated from speculation to value, who built cash positions before the panic, who had the discipline to buy quality assets when everyone else was selling.
The Truth
Here’s what I learned in 20+ years in finance: The market rewards people who think independently and act before the crowd.
When Buffett buys Alphabet while everyone fears AI will destroy it, that’s independent thinking. When Burry closes his fund because he refuses to participate in a speculative bubble, that’s discipline. When long-term Bitcoin holders buy during capitulation while short-term holders panic, that’s understanding human psychology.
The pattern is always the same: The crowd chases what’s already gone up and panics about what’s going down. The wealth builders do the opposite. They buy fear and sell greed. They focus on value when everyone else worships growth. They build cash when everyone else is fully invested.
This week gave you a clear signal. Buffett showed you where value is hiding. Burry showed you where speculation has gone too far. Bitcoin showed you what happens when weak hands meet volatility.
The market always sends signals. The people who build wealth are the ones who listen.
👉 For daily insights, follow me on X /Twitter; Instagram Threads; Facebook; or BlueSky, and turn on notifications!
(3) 3 Important Charts (and why they matter):
Today, we analyze:

(1) 655 US large companies have gone bankrupt year-to-date, the highest number in 15 years.

(2) U.S. grocery prices have never been more expensive: The average cost of groceries for a family of 4 is now up to a record $1,030/month.

(3) Global stocks have risen a lot faster than the U.S. this year

(4) Final thought - What these 3 charts teach us
1️⃣ 655 US large companies have gone bankrupt year-to-date, the highest number in 15 years.

💡Andrew’s Analysis:
S&P Global Market Intelligence data shows that 655 large US companies have filed for bankruptcy year-to-date through October 2025, the highest number in 15 years. This already exceeds every full-year total since 2011 except for 2024. Since 2022, bankruptcies have nearly doubled, up almost 100%.
The pace is accelerating. October saw 68 filings, September had 66, and August recorded 76, the highest monthly reading in at least six years. By sector, industrials lead with 98 bankruptcies, followed by consumer discretionary at 80 and healthcare at 45.
The chart shows a striking pattern: after the 2010 crisis (828 bankruptcies), filings steadily declined until hitting a low of 372 in 2022. Then they exploded. We’re now on track to match or exceed 2010 levels.
What It Means
This is what the beginning of a crisis looks like. And most people are missing it because it’s happening in slow motion.
Corporate bankruptcies don’t spike randomly. They spike when three things converge: high debt levels, rising interest rates, and slowing economic growth. And right now, we’ve got all three.
Here’s what happened: For years, companies borrowed money at near-zero interest rates. They took on massive debt to fund expansions, buybacks, and acquisitions. It was free money, so why not? But then the Federal Reserve started raising rates in 2022, and suddenly that debt got expensive.
Now picture a company that borrowed $100 million at 2% interest. They could handle the $2 million annual payment. But when they need to refinance at 7% interest? That’s $7 million per year. For many companies, that difference between $2 million and $7 million is the difference between survival and bankruptcy.
This wave is just starting. Most corporate debt doesn’t mature all at once. It rolls over gradually. The companies filing for bankruptcy now are just the first dominos. More are coming.
The Sectoral Breakdown
Industrials are leading with 98 bankruptcies. That’s not random. Industrial companies are capital-intensive. They borrowed heavily to build factories and buy equipment. When borrowing costs spike and demand softens, they get crushed.
Consumer discretionary at 80. That connects directly to the grocery crisis. When families are spending more on food, they’re spending less on everything else. Discretionary spending dies first.
Healthcare at 45. This one’s surprising until you think about it. Healthcare companies face regulatory pressure, labor shortages, and consumers cutting back on elective procedures. When people can’t afford groceries, they definitely can’t afford unnecessary medical care.
Translation: This is spreading. What started in cyclical sectors is now hitting everything. Software companies, which everyone thought were immune because they’re “asset-light,” are next. Why? Because even software companies have debt. And even software companies need customers with money to spend.
The Long-Term
Implication #1: Job losses will accelerate.
Each bankruptcy represents hundreds or thousands of jobs disappearing. And we’re not talking about 655 companies. We’re talking about potentially 800+ by year-end, matching 2010 crisis levels. Those are real people losing real jobs, which feeds back into weaker consumer spending, which creates more bankruptcies.
Implication #2: Banks are sitting on unrealized losses.
When companies go bankrupt, their lenders take losses. Banks that lent money to these 655 companies just took haircuts on those loans. We saw what happened in 2008 when bank losses spiraled. We’re not there yet, but the warning signs are flashing.
Implication #3: Private equity is in trouble.
Many of these bankruptcies are private equity-backed companies that were loaded up with debt in leveraged buyouts. When PE firms can’t flip companies for a profit, the entire private equity model breaks down. And private equity controls a huge chunk of the American economy. If PE implodes, it takes a lot of jobs and businesses with it.
2️⃣ U.S. grocery prices have never been more expensive: The average cost of groceries for a family of 4 is now up to a record $1,030/month.

💡Andrew’s Analysis:
Arbor Data Science reported that the average monthly cost of groceries for a family of four in the US hit a record $1,030 in August 2025, up from $750 in January 2017. That’s a $280 increase, or 37% more expensive in just eight years. Even more shocking: $150 of that increase happened in just 2021-2022 alone.
On an annual basis, families now spend over $12,360 per year on groceries compared to $9,000 in 2017. That’s an extra $3,360 coming out of household budgets every single year. Since COVID hit, grocery costs have surged 30%.
What It Means
This chart isn’t about inflation. It’s about the slow-motion destruction of the American middle class.
When I worked in banking, we had a rule: when basic necessities take up a bigger chunk of people’s income, discretionary spending collapses. And when discretionary spending collapses, the consumer economy follows.
Think about what an extra $280 per month means for a typical family. That’s $3,360 per year they’re not saving for retirement. Not investing in the stock market. Not spending on restaurants, vacations, or new cars. That money is just gone, absorbed by the rising cost of keeping food on the table.
This isn’t temporary. The chart shows a relentless climb with no signs of reversing. The spike in 2021-2022 came from supply chain disruptions and pandemic-related shocks. But costs didn’t come back down afterward. They kept climbing.
Why? Because once companies realize consumers will pay higher prices, they rarely lower them. Psychologists call this “price anchoring.” Once you’re used to paying $8 for eggs, the company has no incentive to drop it back to $4. The new normal becomes the new floor.
The Psychological Damage
There’s a hidden cost here that no chart can capture: the erosion of financial confidence.
When families watch their grocery bills climb month after month while their paychecks stay flat, they stop believing they can get ahead. They stop taking risks. They stop investing. They go into survival mode. And a population in survival mode doesn’t build wealth. It just tries not to drown.
In my 20+ years watching markets, I’ve learned that consumer confidence is everything. When people feel broke, they act broke. They stop spending. They stop investing. And that creates a self-fulfilling prophecy where the economy actually does get worse.
The Long-Term
Implication #1: The American Dream is shifting from “get ahead” to “just survive.”
When basic necessities eat up more of your income, you can’t invest in your future. You can’t save for retirement. You can’t start a business. You can’t take the risks that build wealth. A society that’s spending all its money on food is a society that’s slowly getting poorer.
Implication #2: Political and social instability will increase.
Throughout history, when food prices spike, revolutions follow. I’m not saying we’re heading for a revolution, but I am saying that economic stress creates political volatility. People vote differently when they can’t afford groceries. They support policies they normally wouldn’t. They look for someone to blame. Economic anxiety doesn’t stay economic. It bleeds into everything.
Implication #3: Consumer discretionary stocks are in trouble.
If families are spending $280 more per month on groceries, that’s $280 less for everything else. Restaurants, entertainment, retail, travel, these sectors are going to struggle. Companies like Target, Home Depot, and even luxury brands will face headwinds as consumers cut back. This isn’t a temporary blip. This is a structural shift in spending patterns.
3️⃣ Global stocks have risen a lot faster than the U.S. this year

💡Andrew’s Analysis:
MSCI data shows that during the Trump presidency (from January 19, 2025, through November 7, 2025), US stocks returned just 13% in dollar terms, ranking 21st out of 23 developed markets. Spain led with 61% returns, Austria posted 58%, Finland gained 45%, and Ireland climbed 42%. Even Hong Kong (41%), Italy (39%), and Japan (29%) crushed US returns.
The only developed markets that performed worse than the US were Australia (11%), New Zealand (0%), and Denmark (-17%). Nearly every major developed country outperformed America by a massive margin.
The returns almost exactly mirror the devaluation of the dollar.
What It Means
This chart destroys the most powerful investment narrative of the last decade: American exceptionalism.
For years, the conventional wisdom was simple: US stocks always outperform. American companies are the best in the world. Why invest anywhere else? Pension funds, hedge funds, and retail investors all piled into US stocks, particularly the “Magnificent Seven” tech giants, because they believed America was untouchable.
That story just died.
Spain’s market is up 61% while the US is up 13%. That’s not a small gap. That’s a 5x difference in returns. If you invested $100,000 in Spanish stocks at the start of the Trump presidency, you’d have $161,000 today. The same money in US stocks? $113,000. That’s a $48,000 difference in less than a year.
But here’s what’s really fascinating: look at what outperformed. Spain, Austria, Finland, Ireland, Portugal. These aren’t economic powerhouses. They’re not growing at 10% per year. They’re mature, stable European economies that everyone dismissed as “old Europe.” And they’re absolutely destroying US returns.
The Dollar
When the dollar weakens, foreign stocks get a double boost for US investors. You make money from the stock going up, and you make money from the currency conversion. If the dollar is falling, international investing becomes a currency hedge and a performance play.
Think about what this means. If foreign stocks are outperforming this much even after accounting for currency moves, the underlying businesses are doing something right that American businesses aren’t.
The Tariff Effect
Tariffs are fundamentally anti-business. They raise costs, disrupt supply chains, and create uncertainty. When the US government starts a trade war, US companies suffer and foreign companies (who face less US competition) benefit.
Tariffs signal that the US is turning inward, becoming protectionist, and losing its competitive edge. Markets price that in immediately. Capital flees closed economies and flows to open ones.
What the AI Dominance Narrative Missed
The US market’s entire story for the past two years has been: Nvidia, Microsoft, Google, Meta, maybe a couple others. Everything else? Dead money.
That’s not a healthy market. That’s a market propped up by a handful of stocks trading at bubble valuations. Strip out the AI hype, and US stocks have gone nowhere. Meanwhile, European and Asian companies are delivering broad-based returns across sectors.
The Long-Term
Implication #1: The dollar’s decline is just beginning.
If returns are tracking dollar devaluation, and the dollar is falling because of bad policies (tariffs, deficits, political chaos), then this trend has years to run. A falling dollar means rising import costs, which feeds back into inflation, which means your purchasing power keeps eroding.
Implication #2: American companies will lose their competitive edge.
US companies got complacent. They stopped innovating in favor of financial engineering (buybacks, M&A). European and Asian companies kept grinding, cutting costs, improving margins. When the scoreboard flips this dramatically, it’s telling you something fundamental changed about who’s winning the global competition.
4️⃣ Final thought - what these charts teach us
These three charts tell a story about the breakdown of the American economic system.
Start with the grocery chart. American consumers are getting squeezed. They’re spending more on basics and have less left over for everything else. That creates the perfect storm for corporate bankruptcies (chart 1). Companies can’t sell products to people who can’t afford them. Debt costs are rising. Revenues are falling. Bankruptcies explode.
Meanwhile, the US government responds to economic stress by implementing tariffs and protectionist policies, which makes American companies less competitive globally. Capital sees this and rotates to other countries where governments aren’t sabotaging their own businesses. That’s why international stocks are crushing US stocks (chart 3).
But it gets worse. These three forces feed on each other:
The Cycle:
High costs crush consumers → Less discretionary spending
Less spending kills companies → Bankruptcies surge, jobs disappear
Job losses reduce income → Even less spending ability
Weak companies underperform globally → Capital flees US markets
Capital flight weakens dollar → Import costs rise
Rising import costs → Groceries get even more expensive
Return to step 1
This is a doom loop. And once it starts, it’s very hard to stop.
Themes
Theme #1: The American Consumer Is Tapped Out
Every chart points to the same conclusion: Americans are out of money. They can’t afford groceries. The companies they work for are going bankrupt. And the stock market gains they used to count on aren’t happening. The wealth effect that drove the economy for a decade just reversed.
Theme #2: Debt Is the Enemy
Companies borrowed too much. Now they can’t service their debt. Consumers are stretched thin. The government’s response (tariffs, deficits) makes it worse. High debt plus high interest rates plus slow growth equals crisis. Every time.
Theme #3: America Is Losing Its Economic Dominance
The idea that US assets are always the best investment just got destroyed. Other countries are growing faster, their companies are more competitive, and their markets are delivering better returns. The world is moving on from American exceptionalism.
How to Profit
Framework #1: The Geographic Diversification Strategy
The Problem: If you’re 100% invested in US stocks, you’re making a massive bet that America will reverse these trends. Based on the data, that’s a losing bet.
The Solution: Rebuild your portfolio with global exposure.
Step-by-step:
Take inventory: What percentage of your portfolio is in US stocks? For most Americans, it’s 80-100%.
Set a target allocation: Aim for 50-70% US, 10-30% international developed markets, 5-15% emerging markets. This gives you exposure to the winners (like Spain, Austria, etc.) while maintaining some US exposure.
Use low-cost ETFs:
VXUS (Vanguard Total International) for broad international exposure
VEA (Vanguard Developed Markets) for Europe and Asia
VWO (Vanguard Emerging Markets) for growth exposure
Rebalance systematically: Move 5% of your portfolio from US to international every month until you hit your target. This dollar-cost averages you into the trade.
Why it works: The data shows international stocks are outperforming by 3-5x. Even if that margin narrows, you’re better off being diversified than concentrated in underperforming US markets. The mathematical reality is simple: you can’t outperform if you’re only playing in the slowest market.
Framework #2: The Bankruptcy-Proof Career Strategy
The Problem: 655 companies have already gone bankrupt this year. Your job might be next, especially if you work in industrials, consumer discretionary, or heavily indebted companies.
The Solution: Build career resilience before you need it.
Step-by-step:
Assess your company’s health:
Is your company profitable or burning cash?
Does it have high debt levels?
Is it in one of the high-bankruptcy sectors (industrial, consumer discretionary, healthcare)?
Are revenues growing or shrinking?
Build an emergency fund: Save 6-12 months of expenses in cash. I know that’s hard when groceries are expensive, but this is non-negotiable. Start with $1,000, then $5,000, then keep building. The goal is freedom. Freedom to walk away if things go south.
Diversify your income:
Start a side business or freelance work in your spare time
Build skills that are transferable across industries
Network aggressively (most jobs come through connections, not applications)
Position yourself in recession-resistant sectors:
Healthcare (people always need medical care)
Essential services (utilities, food production)
Government and education (more stable, less volatile)
Technology companies with actual profits (not speculative startups)
Why it works: The bankruptcy wave is accelerating. If you wait until you’re laid off to prepare, it’s too late. Career preparation is like insurance: you buy it before you need it, not after.
Mistakes That Will Cost You
Red Flag #1: Assuming “America Always Comes Back”
The most dangerous assumption you can make is that these trends will reverse because “America always bounces back.” Maybe. But maybe not this time. The bankruptcies, the consumer stress, the loss of competitiveness, these are structural problems that don’t fix themselves. They require policy changes, leadership, and time.
Don’t bet your retirement on blind faith in American exceptionalism. The data says the exceptionalism era is over.
Red Flag #2: Staying 100% Invested in US Stocks
If your entire portfolio is in VOO or SPY or the S&P 500, you’re making a concentrated bet that contradicts everything these three charts are telling you. Diversification isn’t optional anymore.
Red Flag #3: Ignoring the Grocery Squeeze
If your budget hasn’t adjusted for 37% higher food costs, you’re accidentally going into debt or eating into your savings. Run the numbers. Most people are in denial about how much their spending has increased.
Red Flag #4: Working for a Zombie Company
If your employer is heavily indebted, unprofitable, and in a distressed sector, start looking for an exit now. Don’t wait for the bankruptcy announcement. By then, it’s too late to get a good severance or find a new job without panic.
Historical Parallels
These charts look a lot like the lead-up to past crises.
In 2000, US tech stocks were the only game in town. Everyone piled in. Valuations didn’t matter. Then international markets started outperforming, capital rotated away from the US, and the Nasdaq crashed 78%.
In 2007, consumers were stretched thin. Corporate debt was high. Bankruptcies started ticking up. Everyone ignored the warning signs because “housing never goes down.” Then it did. And the financial system nearly collapsed.
In 2025, we’ve got consumer stress (chart 2), corporate distress (chart 1), and capital flight (chart 3). The ingredients are all here. The only question is timing.
I’m not saying we’re on the verge of collapse. I’m saying the warning lights are flashing.
The Truth
Here’s what I learned in 20 years in finance: Countries, like companies, have life cycles.
America dominated the 20th century. We had the best companies, the strongest currency, the most innovative culture. But dominance breeds complacency. And complacency breeds decline.
The data show that America’s dominance may be fading. Not disappearing, but fading. Other countries are hungrier, more competitive, more innovative in ways that matter.
The investors who build wealth over the next decade won’t be the ones clinging to the American Dream narrative. They’ll be the ones who accept reality, adapt quickly, and position their portfolios for a multipolar world where America is just one player among many.
The grocery crisis, the bankruptcy wave, and the global market shift aren’t separate stories. They’re chapters in the same book.
The market doesn’t care about patriotism. It only cares about results. And right now, the results are clear: diversify globally and protect your purchasing power.
👉For more charts, follow me on Instagram; Facebook; LinkedIn; and turn on notifications!
(4) Economic Outlook & Market Sentiment:
How do you cut through the noise and understand what’s really happening? The secret is to look at three different types of information: the feelings people, the actions of investors, and the facts about the economy. When you put them together, you get a clear picture.
1) Fear & Greed Index
The Trend: NEGATIVE (But That’s Positive for Contrarians)
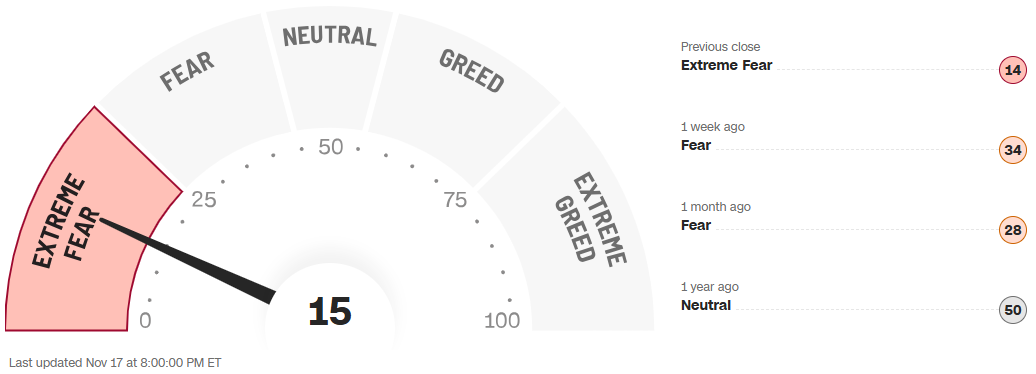
Fear & Greed Index currently sits at 15, signaling extreme fear. This represents a dramatic shift from just one week ago (34, still fear) and one month ago (28, fear). One year ago, the index sat at a neutral 50. The needle has swung from balanced to panicked in just 12 months.
What It Means
Think of the Fear & Greed Index like a pendulum. When it swings to extreme greed (above 75), everyone’s buying and prices are inflated. When it swings to extreme fear (below 25), everyone’s selling and prices are depressed. The pendulum never stays at the extremes. It always swings back to the middle.
Here’s the psychological trap most investors fall into: They feel smart selling when the index hits 15 because “things could get worse.” But that’s backward. Extreme fear is the symptom of things already being bad. The question is: has the bad news been priced in?
The Long-Term
Implication #1: Mean reversion is one of the most powerful forces in markets.
The index has averaged around 50 over its history. When it hits 15, the mathematical probability strongly favors a move back toward 50. That doesn’t mean it happens tomorrow, but over weeks or months, the pendulum swings back.
Implication #2: Extreme fear creates mispricing.
When everyone’s selling indiscriminately, quality companies get thrown out with the trash. You get the chance to buy Microsoft, Google, and Visa at prices that won’t be available when the fear subsides. Panic creates opportunity because fear doesn’t discriminate between good and bad assets.
Implication #3: The crowd is almost always wrong at extremes.
When 85% of the sentiment spectrum is showing fear (100 is max greed, 15 is where we are now), that means the overwhelming majority has already sold or positioned defensively. Who’s left to sell? Nobody. And when there are no more sellers, prices can only go up.
2) AAII Investor Index
The Trend: NEGATIVE (Bearishness at Multi-Year Highs)
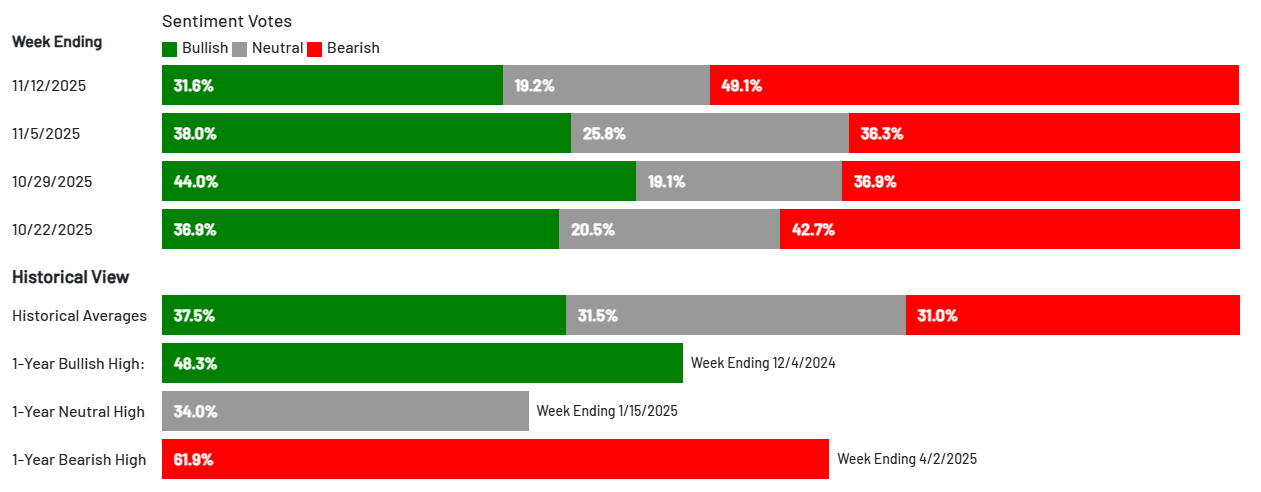
The American Association of Individual Investors (AAII) reported that bearish sentiment surged to 49.1% in the week ending November 12, 2025, the highest level in over a year and far above the historical average of 31.0%. This marks the 50th time in 52 weeks that bearishness has exceeded its historical average.
Meanwhile, bullish sentiment collapsed to 31.6%, well below the historical average of 37.5%. Neutral sentiment also plummeted to 19.2%, far below its 31.5% historical average (and marking the 69th time in 71 weeks it’s been below average).
The bull-bear spread (bullish minus bearish) dropped to -17.5%, meaning bears outnumber bulls by 17.5 percentage points. This is the 37th time in 41 weeks the spread has been unusually low.
In just three weeks, bullish sentiment dropped 12.4 percentage points while bearish sentiment surged 12.8 percentage points. That’s not a gradual shift. That’s a panic.
What It Means
The AAII survey measures the “dumb money.” That sounds harsh, but it’s statistically accurate. Individual retail investors have a documented track record of being optimistic at tops and pessimistic at bottoms. They’re contrarian indicators: when they’re bullish, be cautious. When they’re bearish (like now), get aggressive.
Here’s why this works: Individual investors react emotionally to price movements. When stocks have been falling (as they have recently), they extrapolate that trend into the future. “Stocks are down 5%, so they’ll keep falling.” This creates a self-reinforcing feedback loop where falling prices breed more pessimism, which breeds more selling.
But professional investors know that markets are forward-looking mechanisms. By the time everyone’s bearish, the bad news is already priced in. The market doesn’t care what happened yesterday. It cares what’s happening six months from now.
When bearishness hits 49.1% (like it is now), it means nearly half of individual investors surveyed expect stocks to fall over the next six months. But if they expect stocks to fall, they’ve already sold or positioned defensively. Which means there’s limited selling pressure left.
Think about it logically: If 49.1% of investors expect stocks to fall, what percentage have already acted on that belief? Probably most of them. Which means the selling has already happened. And when the selling stops, prices stabilize. And when prices stabilize, the early buyers make money.
Historical Patterns
I’ve been tracking the AAII survey for over a decade, and the pattern is consistent: Extreme bearishness (above 45%) has historically marked excellent buying opportunities.
March 2020 (COVID crash): Bearishness spiked above 50%. Stocks rallied 70%+ over the next year.
August 2011 (debt ceiling crisis): Bearishness hit 54%. The S&P 500 bottomed within weeks and rallied 30% over the next year.
October 2008 (financial crisis): Bearishness exceeded 60%. That marked the generational buying opportunity.
The pattern repeats because human psychology doesn’t change. People get scared, they sell, and then they watch from the sidelines as prices recover. The investors who profit are the ones who do the opposite of what feels comfortable.
3) Economic Indicators
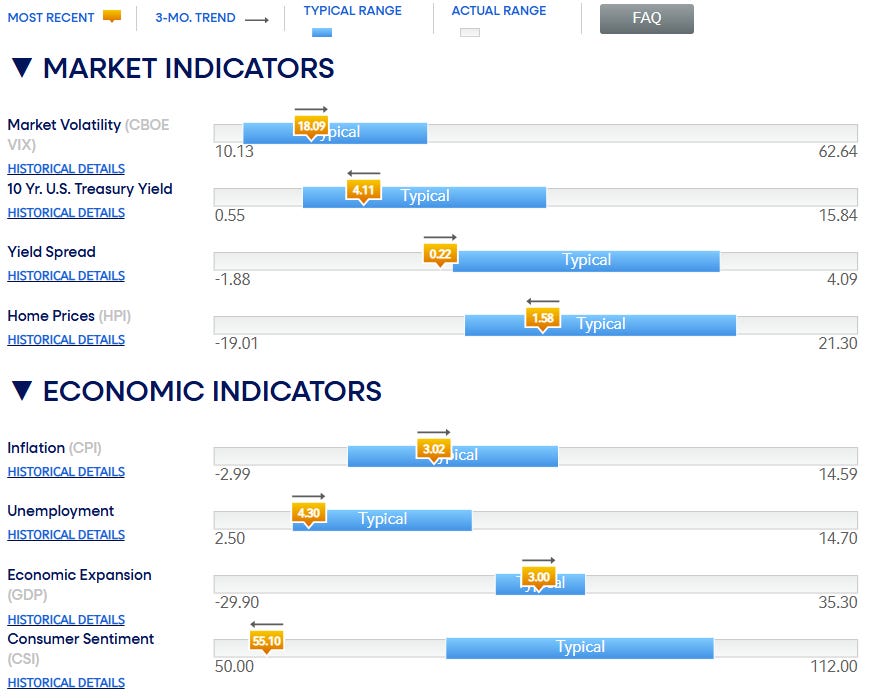
The Trend: MIXED (Some Typical, Some Concerning)
The economic indicators dashboard, shows a mixed picture.
Here’s the disconnect: The economy is performing reasonably well, but people feel terrible about it. This is the most important insight from this dashboard.
Look at the data objectively:
GDP is growing at 3% (healthy)
Unemployment is 4.3% (low)
Inflation is 3% (elevated but manageable)
The yield curve is positive (no recession signal)
Home prices are stable (no housing crash)
But consumer sentiment is near its lows. Why? Because people don’t experience the economy through data. They experience it through their grocery bills, gas prices, and social media feeds telling them everything is falling apart.
This is what behavioral economists call a “perception gap.” The difference between how the economy actually is and how people feel about it. And this gap creates massive opportunity for investors who can separate facts from feelings.
When I worked at JPMorgan, we had a saying: “Buy the fear, not the fundamentals.” What we meant was that when sentiment is terrible but fundamentals are solid, that’s the highest-probability trade in all of investing.
Right now, consumer sentiment is at 55 (terrible), but GDP is growing at 3%, unemployment is 4.3%, and we don’t have a recession signal. This is exactly that setup.
The Long-Term
Implication #1: When fundamentals are solid but sentiment is terrible, bet on the fundamentals.
The economy is growing. People are employed. Inflation is manageable. These are facts. Consumer sentiment is just feelings. Facts win over feelings in the long run.
Implication #2: The perception gap always closes.
Eventually, people realize the economy isn’t as bad as they feared. When that happens, sentiment improves, which drives stock prices higher. You want to buy when the gap is wide (now) and sell when it narrows (when everyone feels good again).
Implication #3: Mixed indicators create paralysis, which creates opportunity.
Most investors look at this dashboard and freeze. “Some things are good, some are bad. I’ll wait for clarity.” But clarity comes with higher prices. By the time all the indicators are clearly positive, stocks will have already rallied.
4) What All This Means
These three indicators aren’t contradicting each other. They’re confirming the same story from different angles. And that story is simple: Everyone’s terrified, but the fundamentals don’t justify the terror.
Connection #1: Fear is Widespread But Fundamentals Are Solid
The Fear & Greed Index shows extreme fear (15)
The AAII survey shows individual investors are the most bearish in a year (49.1%)
But the economic indicators show GDP growing, unemployment low, and no recession signals
What this means: The fear is driven by sentiment and psychology, not by deteriorating fundamentals. This is the definition of opportunity. When people are scared for emotional reasons rather than data-driven reasons, prices overshoot to the downside.
Connection #2: The Crowd Has Already Positioned Defensively
49.1% of individual investors are bearish (AAII)
All seven Fear & Greed components show fear
Safe haven demand is elevated (bonds outperforming stocks)
What this means: The selling has already happened. When nearly half of retail investors are bearish and safe haven demand is high, there’s limited selling pressure left. Everyone who was going to sell has already sold. Which means we’re near a bottom.
Connection #3: The Perception Gap Is Massive
Consumer sentiment is near lows (55.10 on the CSI)
But GDP is growing at 3% and unemployment is 4.3%
The yield curve is positive (no recession signal)
What this means: People feel much worse about the economy than the data warrants. This creates a mispricing in asset values. Stocks are being sold based on how people feel, not on how companies are actually performing. This gap always closes, and when it does, prices snap back violently.
All three indicators are showing the same thing: capitulation.
Extreme fear on the Fear & Greed Index = Capitulation
Record bearishness on AAII survey = Capitulation
Consumer sentiment at lows despite solid fundamentals = Capitulation
Capitulation is when the last holdouts finally give up. It’s when your uncle who’s been “waiting out the volatility” finally sells at the bottom. Capitulation marks the end of selloffs, not the beginning.
Warren Buffett has a famous quote: “Be fearful when others are greedy, and greedy when others are fearful.” These three indicators are screaming that others are fearful. Which means it’s time to be greedy.
The Lesson
Markets are driven by two forces: fundamentals and sentiment. Fundamentals determine where prices should be long-term. Sentiment determines where prices are today.
When sentiment is positive but fundamentals are weak, you’re in a bubble (2021-2022 tech stocks). When sentiment is negative but fundamentals are strong, you’re in a buying opportunity (right now).
The key is recognizing the divergence. Most investors can’t separate their emotions from the data. They see stocks falling, they feel scared, and they sell. The professionals see stocks falling, check the fundamentals, and when the fundamentals are fine, they buy.
The Truth About Buying When Everyone’s Selling
Here’s what I learned in 20 years watching markets crash and recover: The best buying opportunities feel terrible.
In March 2020, when COVID crashed the market, buying stocks felt insane. Everyone was panicking. The Fear & Greed Index hit single digits. AAII bearishness exceeded 50%. It felt like the world was ending.
The investors who bought at the bottom made 70% returns over the next year.
In 2008, during the financial crisis, buying stocks felt suicidal. Banks were failing. Fear & Greed hit record lows. Bearishness exceeded 60%. It felt like capitalism was collapsing.
The investors who bought at the bottom made generational wealth.
Right now doesn’t feel as extreme as those two examples. But the pattern is the same: Extreme fear, excessive bearishness, and solid fundamentals. That combination has preceded every major rally over the past 50 years.
The market is offering you a gift. The Fear & Greed Index is at 15. Bearishness is at 49.1%. And the economy is still growing at 3% with 4.3% unemployment.
This is the opportunity.
Fear is temporary. Regret lasts forever.
👉 For daily insights, follow me on X /Twitter; Instagram Threads; Facebook; or BlueSky, and turn on notifications!
(5) My stock picks, research, and analysis:
The core idea is simple: Invest in companies with unshakable competitive advantages that are also riding massive, long-term growth waves.
In this issue, we analyze:

(1) Palo Alto Networks (PANW): “The lock on every digital door”

(2) MercadoLibre (MELI): The Amazon + PayPal of Latin America

(3) Meta Platforms (META): The Cash Machine

(4) Final Thoughts
Here’s what most investors miss about the next decade: The companies that will dominate aren’t the ones with the best technology or the flashiest products. They’re the ones that become so embedded in their users’ lives that switching becomes unthinkable. They’re platforms, not products. And right now, three companies are building moats so deep that their competitors are drowning before they even get close.
Palo Alto Networks controls the cybersecurity stack. MercadoLibre owns Latin America’s digital economy. Meta Platforms has 3 billion people checking their apps every single day. These aren’t stocks. They’re monopolies in the making. And in a world where winner-takes-most is the only rule that matters, these three are positioned to take everything.
(1) Palo Alto Networks (PANW): “The lock on every digital door”
Palo Alto Networks (PANW) isn’t just a cybersecurity company. It’s becoming the operating system for digital defense. And just like Microsoft dominated the PC era by owning the operating system, Palo Alto is dominating the cybersecurity era by owning the entire security stack.
Here’s what makes this compelling: Palo Alto serves over 80,000 enterprise customers across 150+ countries through three integrated platforms. Strata handles on-premise network security. Prisma manages cloud-based security. Cortex detects and responds to threats. Most cybersecurity companies offer one piece of the puzzle. Palo Alto offers the whole board.
From fiscal 2020 to 2025 (ending July 2025), revenue grew at a 22% CAGR while adjusted net income grew at 37%. That’s the signature of operating leverage kicking in. More revenue, higher margins, compounding profits. The next-gen security (NGS) segment, which includes Prisma and Cortex, is the growth engine. NGS annual recurring revenue (ARR) hit $5.6 billion in fiscal 2025, accounting for 61% of total revenue. That figure is expected to grow another 26-27% in fiscal 2026.
Why This Matters
The cybersecurity market is fragmented, and Palo Alto’s strategy is to defragment it by force. Here’s how it works:
Most large enterprises use 10-30 different cybersecurity vendors. Each vendor handles a specific function: firewalls, endpoint protection, cloud security, threat detection, etc. This creates a nightmare for security teams. Different dashboards. Different vendors. Different contracts. And most dangerously, gaps between systems that hackers exploit.
Palo Alto’s “platformization” strategy consolidates everything onto three unified platforms. For enterprises, this means one vendor, one dashboard, one contract. Less complexity. Better security. Lower costs. It’s a no-brainer value proposition.
But here’s the genius part: Once you’re on the Palo Alto platform, switching becomes prohibitively expensive. You’d have to rip out your entire security infrastructure and replace it with multiple point solutions. No CIO wants that headache. No CFO wants that cost. No board wants that risk. This creates vendor lock-in at scale.
When I worked in banking, we evaluated cybersecurity vendors every few years. Once a company was embedded across our network, cloud, and endpoints, switching would have cost tens of millions and taken years. We never switched. That’s the power of platform lock-in.
The Numbers
Let’s look at what the market’s pricing in versus what’s realistic:
Current valuation: 54x forward earnings Expected growth: 13% CAGR for revenue and adjusted EPS through fiscal 2028 Market cap: $139 billion
At first glance, 54x earnings seems expensive for 13% growth. But this ignores three critical factors:
Factor #1: Revenue Quality is Exceptional
NGS ARR is growing at 32% (much faster than the overall 13% estimate). This is recurring, high-margin revenue that compounds. And NGS is already 61% of total revenue. As that mix shifts even more toward NGS, total growth will accelerate, not slow down.
Factor #2: Margin Expansion is Baked In
Gross margins are already at 73.4%, but operating margins have room to expand as the platform scales. Software has infinite leverage once you’ve built it. Every new customer adds high-margin ARR with minimal incremental cost.
Factor #3: Recession-Proof Demand
Cybersecurity is non-negotiable. Companies don’t cut security budgets when times get tough. They increase them because the cost of a breach is catastrophic. In a recession, CFOs will cut marketing, travel, and office perks. They won’t cut the firewall protecting their crown jewels.

The Long-Term
Implication #1: The Cybersecurity Market is Consolidating, and Palo Alto is the Consolidator
Niche cybersecurity vendors are struggling. They can’t compete with platform players on price or functionality. Over the next 5 years, expect a wave of acquisitions and shutdowns among smaller competitors. Palo Alto will absorb market share by default as competitors exit.
Implication #2: AI is the Next Moat Layer
Palo Alto is integrating AI across its platforms to automatically detect, respond to, and prevent threats. This creates a flywheel: more data → better AI models → more accurate threat detection → more customers → more data. First-mover advantage in AI-powered security compounds over time.
Implication #3: Cloud Migration is a 10-Year Tailwind
Enterprises are still in the early innings of cloud migration. Every workload that moves to the cloud needs Prisma. Every new SaaS application needs protection. Palo Alto gets paid every time a company modernizes its infrastructure.
What To Do
Buy PANW on any pullback below $190. Any market weakness that pushes it into the high $180s or low $190s is a gift.
Hold for 5+ years. Let the platformization strategy play out. Let the margins expand. Let the AI features compound. This is a compounder, not a quick flip.
(2) MercadoLibre (MELI): The Amazon + PayPal of Latin America
MercadoLibre (MELI) is the most dominant internet company you’ve never heard of. It’s the largest e-commerce marketplace in Latin America. The largest fintech platform. The largest logistics network. And it’s growing 30%+ annually in a region where e-commerce penetration is still in single digits.
Think of MercadoLibre as what Amazon and PayPal would look like if they merged, then operated in a market where nobody has credit cards, banks are distrusted, and traditional retail is still king. That’s the opportunity. And that’s why this could be a 10-bagger from here.
Let’s break down the business:
E-Commerce Platform: MercadoLibre operates marketplaces in 18 Latin American countries. It’s the clear number one, fending off Amazon and Sea Limited. In Q3 2025, active users grew 26% year-over-year to 76.8 million. But here’s the kicker: e-commerce penetration in Latin America is only around 10%, compared to 20%+ in the U.S. and 40%+ in China. The runway is massive.
Fintech Platform (Mercado Pago): This is the hidden gem. Mercado Pago started as a payment processor for MercadoLibre’s marketplace. Now it’s evolved into a full-service digital bank offering payments, credit, savings accounts, and investment products. Monthly active users grew 29% in Q3. Assets under management surged 89%. This is disrupting Latin American banking, which has traditionally been oligopolistic and expensive for consumers.
Logistics Network (Mercado Envios): To compete with Amazon’s fulfillment advantage, MercadoLibre built its own logistics network. This creates faster delivery, better customer experience, and higher margins. It’s also a massive barrier to entry for competitors.
Why This Matters
Latin America is the last major internet market that hasn’t been colonized by U.S. or Chinese tech giants. Amazon tried and failed to crack it. Alibaba hasn’t made inroads. MercadoLibre owns the home turf, and that advantage compounds over time.
Here’s what people miss: Latin America has structural characteristics that make MercadoLibre even more valuable than Amazon:
Characteristic #1: Low Banking Penetration
In the U.S., everyone has a bank account and credit card. In Latin America, 50%+ of the population is unbanked or underbanked. MercadoLibre isn’t just facilitating commerce. It’s bringing hundreds of millions of people into the digital economy for the first time.
When someone signs up for Mercado Pago to buy something on the marketplace, they suddenly have a digital wallet, a credit line, and access to financial services. This creates a flywheel: e-commerce drives fintech adoption, which drives more e-commerce usage, which generates transaction data that enables better credit decisioning, which drives more fintech adoption.
Characteristic #2: Fragmented Retail
Traditional retail in Latin America is dominated by small, independent shops. These merchants need digital tools to compete. MercadoLibre provides them with a storefront, payment processing, logistics, and financing. It’s not just disrupting retail. It’s digitizing it.
Characteristic #3: High Inflation and Currency Volatility
Many Latin American currencies are volatile. People don’t trust local banks. This makes Mercado Pago attractive as a way to store value, earn interest, and make payments in a stable ecosystem. Financial instability in the region is a feature, not a bug, for MercadoLibre’s growth.
The Numbers
Market cap: $104 billion Gross margins: 45.14% (and expanding as fintech scales) Revenue growth: 30%+ annually User growth: 26-29% across e-commerce and fintech
Compare this to Amazon, which trades at a $2+ trillion market cap. Latin America has half the population of the U.S. and China combined. If MercadoLibre captures even a fraction of what Amazon achieved in the U.S., this stock could easily 5-10x over the next decade.

The Long-Term
Implication #1: The Network Effect Creates an Insurmountable Moat
Every new buyer attracts more sellers. Every new seller attracts more buyers. Every transaction generates data that improves recommendations, fraud detection, and credit underwriting. This is a textbook two-sided network effect that becomes stronger with scale.
Implication #2: Fintech is the Profit Engine
E-commerce has thin margins (MercadoLibre’s take rate is around 15%). But fintech margins are 3-5x higher. As Mercado Pago grows from 30% of revenue to 50%+, overall margins will expand dramatically. This is what happened with PayPal. It’s happening again with MercadoLibre.
Implication #3: First-Mover Advantage Compounds
MercadoLibre has been in Latin America for 25+ years. It knows the regulatory landscape. It has relationships with governments. It has logistics infrastructure competitors can’t replicate. This isn’t a market where a well-funded startup can just appear and compete. The barriers are too high.
