

💥 Investing Research and Market Update + Analysis [December 3, 2025]
U.S. housing market correction; Fed pumps $13.5 billion into banks; Black Friday sales strong; Gold outperforms S&P 500; Silver hits new high; 4 stocks I'm buying: $META $AXP $GRAB $DY; and much more!

👋 Good morning my friend, and thanks for joining 108,000 subscribers who trust our newsletter to get smarter with money, investing, and the economy!
📬 In this issue we analyze:

1. Market & Economic Update
2. 5 Important Finance Events
3. Economic Outlook & Market Sentiment
4. My Stock Picks & Research
5. Insider Trades from Billionaires, Politicians & CEOs
6. Top 5 Stocks this Week
7. Swing Trade of the Week
8. 5 Stocks to Watch (Earnings this Week)
9. Real Estate Market Update
10. Interest Rate Predictions
11. Technical Analysis (S&P 500, Tech, Bitcoin)
12. 3 Important Events this Week
This issue has so much great advice to help you build wealth, but before we get into it, please help us and:
Hit the ❤️ LIKE button on this post and help us grow on Substack 🙏
Share this newsletter with friends & family to help them get smarter with money, investing, and the economy!
Become a paid subscriber and support our research and writing! (Get a 30-day free trial with this link) (learn about the benefits here)
(1) Market & Economic Analysis:
Here’s everything important happening right now:
Black Friday sales were strong, indicating consumer confidence.
December is historically a strong month for the S&P 500, with average gains of 1.3% and a 72% chance of rising.
The upcoming Federal Reserve interest-rate decision on Dec. 10 could impact this trend, with high odds of a rate cut.
Silver hit a new high.
Gasoline prices fell to a four-year low.
India’s Nifty 50 index hit an all-time high with year-to-date gains of 11%.
💡Andrew’s Deep Dive & Analysis:
Most investors see strong Black Friday numbers and think: “Great, consumers are back!” But that misses the real story.
When I worked on Wall Street, we’d dig into the details behind the headlines. And this year’s holiday data reveals something more important than just strong sales numbers, it shows you exactly how to position your money for 2026.
Here’s what’s actually happening: Americans spent more on Black Friday (up 4.1%), but they bought 2% fewer items. Think about that. Fewer transactions. Higher prices. That’s not inflation. That’s choice. (This is the difference between surviving and thriving in uncertain times.)
What Quality Over Quantity Really Means
We’ve seen this before. During my 15 years in finance, I watched this pattern play out in every economic transition: consumers stop buying everything and start buying what matters.
The 2008-2010 recovery followed this exact script. People didn’t rush back to buy cheap stuff. They saved longer, researched harder, and bought better. The companies that won? Apple (premium phones), Lululemon (expensive workout gear), Whole Foods (pricier groceries). The companies that struggled? Retailers racing to the bottom on price.
Here’s why this matters for you right now: when consumers trade up instead of trade down, certain stocks outperform. It’s not about total spending. It’s about where that spending goes.
The Fed Rate Cut
Let’s connect the dots between Fed policy and our investments.
The Fed’s about to cut rates in December, 90% probability. Most people think: “Great, cheaper borrowing!” But that’s surface-level thinking. Here’s what actually happens when rates drop:
Your high-yield savings account pays you less. That 5% you’re earning? It’ll become 4.5%, then 4%, then 3.5%. Suddenly, keeping all your money in “safe” savings costs you opportunity.
This creates what Warren Buffett calls “forced courage.” When bonds and savings accounts pay less, investors have to consider stocks. (Not because stocks are risky, because staying in cash becomes the riskier long-term bet.)
December’s Advantage
Here’s a stat you need to know: the S&P 500 gains 72% of the time in December, the best monthly win rate all year.
Why? Three reasons:
1. Tax-loss harvesting ends. Investors stop selling losers for tax benefits and start buying opportunities.
2. Fund managers rebalance. Big institutions add to positions before year-end reporting. This creates upward pressure.
3. Positive seasonality becomes self-fulfilling. When everyone expects December to be good, everyone positions for it to be good. And that expectation becomes reality.
But here’s what matters: you can’t just buy anything in December and expect to win. You need to buy what’s actually positioned to benefit from lower rates and selective consumer spending.
Three Moves to Make This Month
Framework #1: Rate-Cut Winners
When rates drop, certain investments always outperform. Here’s my mental model:
Real estate (REITs): Lower borrowing costs = higher property values
Utilities and dividend stocks: When bonds pay less, investors chase yield elsewhere
Small-cap growth: Smaller companies benefit more from cheaper capital
What to do: Review your portfolio. If you’re 100% in mega-cap tech or sitting in cash, you’re missing the rate-cut opportunity. Allocate 10-20% to rate-sensitive sectors before the Fed announces.
Framework #2: Quality Shift Strategy
Remember those Black Friday numbers? Fewer items, higher prices. That’s an investing signal.
The companies winning right now:
Premium brands (not discount retailers)
E-commerce leaders (online sales up 10.4% vs. in-store up 1.7%)
Experiences over stuff (active apparel and luxury up, commodity goods flat)
What to do: Ask yourself: “Would I pay more for this company’s product?” If yes, it’s probably positioned well. If you’d only buy it on deep discount, it’s probably struggling.
Framework #3: December Momentum Play
Here’s a rule I learned at JPMorgan: “Don’t fight the seasonal trend, but take profits before it reverses.”
December historically strong? Position for it. But also remember: January can bring tax-selling pressure and profit-taking.
What to do:
Add to winning positions now (early December)
Set trailing stops for late December
Review everything January 2nd with fresh eyes
The Big Picture
Let me pull all these threads together.
Lower gas prices (now at four-year lows) + strong holiday spending + likely Fed rate cuts = consumers have more money and cheaper borrowing costs. That’s typically bullish for stocks heading into a new year.
But here’s the contrarian insight: everyone sees this. Which means it’s probably priced in.
The real opportunity? Finding the sectors and stocks that benefit from these trends but haven’t fully reflected them yet. Small-caps trading at discounts to large-caps. International markets (like India’s Nifty 50 hitting highs) that Americans ignore. Commodity plays like silver reaching new peaks while most investors chase AI stocks.
The Most Valuable Lesson From This Week’s Data
When I analyze markets now, I think about what my mentor told me years ago: “The market doesn’t reward you for knowing what everyone knows. It rewards you for understanding what everyone’s missing.”
Everyone knows December is usually good. Everyone sees Black Friday sales rose. Everyone expects a Fed rate cut.
What they’re missing: The shift from quantity to quality in consumer behavior signals a maturing recovery. The last time we saw this pattern (2009-2010), the next three years delivered 15%+ annual returns for investors who positioned correctly.
Next Steps
Here’s what to do this week:
1. Review your cash position. If you’re holding more than 6 months of expenses in savings, consider moving some to investments before rates drop further.
2. Check your sector allocation. Are you overweighted in last year’s winners? Rebalance toward rate-sensitive and quality-focused sectors.
3. Set a calendar reminder for January 2nd. Review everything with fresh eyes after the December rally plays out.
4. Create a shopping list. Write down 5-10 stocks you’d love to own if they pulled back 10-15%. January volatility might give you that chance.
Final Thought
December’s historically strong. Fed cuts are coming. Consumers are spending smart, not scared. The setup favors being invested, not sitting in cash.
But smart investing isn’t about predictions. It’s about positioning. (You can’t control what markets do. You can control how you’re positioned when they move.)
The investors who win aren’t the ones who perfectly time every move. They’re the ones who understand the patterns, position accordingly, and take action while others wait for more certainty.
👉 For daily insights, follow me on X /Twitter; Instagram Threads; Facebook; or BlueSky, and turn on notifications!
(2) 5 Important Finance Events (and what it means):
This week, we analyze:

(1) The U.S. housing market is going to face a price correction “worse than 2008” according to housing analyst Melody Wright

(2) Federal Reserve officially ends quantitative tightening

(3) Silver reaches new all-time high

(4) Federal Reserve pumped $13.5 billion into the U.S. banking system through overnight repos, the 2nd largest liquidity injection since Covid

(5) Gold now outperforming the S&P 500 over the last 30 years
1️⃣ The U.S. housing market is going to face a price correction “worse than 2008” according to housing analyst Melody Wright
Newsweek reported that housing analyst Melody Wright expects a price correction that could be “worse than 2008.” While everyone remembers the 2008 crash, Wright warns that the next drop could be even steeper. She predicts home prices could fall by nearly 50% in some areas starting next year. The logic here is simple but scary. Home prices have skyrocketed, but people’s incomes have not kept up. This gap is unsustainable.
Right now, we have a “frozen” market. Zillow reports that 53% of homes lost value over the last year. Inventory is rising because people cannot afford to buy, but sellers are stubborn about lowering prices. Wright points out that the only things selling right now are expensive homes for rich buyers, which makes the average price look higher than it really is. Under the surface, the market for regular homes is cracking.
Long-Term View: This signals a return to reality. For years, we treated homes like Bitcoin, expecting them to go up 20% every year. That era may be over. If prices drop to match incomes, trillions of dollars in “paper wealth” will vanish from the economy. This creates a “reverse wealth effect” where people feel poorer and stop spending, which slows down the whole economy.
Advice: Reassess Your Housing Exposure
If you’re thinking about buying a home in 2026, wait. Wright’s timeline suggests early 2026 is when price drops accelerate. Even if she’s only half right, waiting six months could save you 10-20%.
If you’re sitting in a primary residence, don’t panic. You’re living there, not selling. But don’t count on home equity as your retirement plan.
2️⃣ Federal Reserve officially ends quantitative tightening
The Federal Reserve officially ended its “Quantitative Tightening” program on December 1. For the last two years, the Fed was draining money out of the system to fight inflation. That stopped this week. Not only did they stop draining money, but they also injected $13.5 billion into the banking system to keep things moving.
Think of the economy like a car engine. Quantitative Tightening was the Fed taking oil out of the engine to slow it down. Now, they are putting oil back in. Historically, when the Fed stops tightening and starts adding liquidity (money), assets like stocks and crypto tend to go up because there is more cash floating around looking for a home.
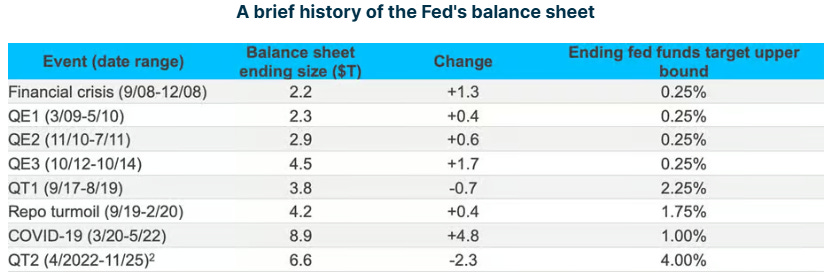
Long-Term View: This is a major shift. The Fed is admitting that the banking system needs help. By adding liquidity, they are essentially putting a “safety net” under the market. This usually devalues the dollar over time but boosts the price of assets like stocks and real estate. It means cash is trash, and assets are king.
Advice: Position for Liquidity Expansion
The Fed ending QT means cash becomes less attractive. Here’s my framework:
The 60-30-10 Liquidity Strategy:
Keep 60-80% in core positions (based on your risk tolerance)
Put 20-30% in rate-sensitive assets (REITs, dividend stocks, small-caps that benefit from cheaper capital)
Allocate 10-15% to inflation hedges (precious metals, commodities, real assets)
Why this split? You’re positioned for the Fed’s intended outcome (asset rally) while protecting against the unintended outcome (inflation from too much liquidity).
3️⃣ Silver reaches new all-time high
Silver prices hit a new record high, driven by a massive shortage of physical metal. Silver is unique. It is not just money; it is an industrial ingredient. We need it for solar panels, electric vehicles, and electronics. We are using silver faster than we can mine it. Mines in South America are producing less, but demand from India and the green energy sector is exploding.
Deutsche Bank predicts silver supply for industrial use will be the tightest on record. Investors are waking up to this. They are buying silver not just to make money, but because they are scared of inflation and want a hard asset that the government cannot print more of.

Long-Term View: We are entering a “Commodity Supercycle.” As the world tries to switch to green energy, we need physical stuff like copper and silver. This is simple supply and demand. If you need silver to build the future, and there is not enough silver, the price has to go up. Silver is moving from a “forgotten rock” to a strategic asset.
Advice: Add Strategic Silver Exposure
You don’t need to go all-in on silver. But a 2-5% allocation makes sense given the supply-demand imbalance.
Your options:
Silver ETFs (easiest, most liquid)
Physical silver (if you want to hold it yourself)
Silver mining stocks (higher risk, higher potential return)
Companies using silver in production (EVs, solar, AI hardware)
The key is buying now before industrial demand overwhelms investment supply. Deutsche Bank’s forecasting record ETF holdings for a reason.
4️⃣ Federal Reserve pumped $13.5 billion into the U.S. banking system through overnight repos, the 2nd largest liquidity injection since Covid

Look at the red circle in the chart above. That spike represents $13.5 billion pumped into the banking system in a single day. This is the second-largest injection since the COVID panic and is even higher than the peak of the Dot Com bubble.
What this means: Think of the “Repo Market” as a pawn shop for banks. When banks run out of cash at the end of the day, they trade safe assets (like Treasuries) for cash from the Fed to keep operating. Normally, banks trade with each other. When they run to the Fed for this much money, it means banks are scared to lend to each other, or they are simply out of cash.
Long-Term Insight: When I worked on Wall Street, we called this “clogged plumbing.” This spike is a warning light on the dashboard. It tells us that despite the stock market hitting highs, the foundation is fragile. The Fed is being forced to step in as the “buyer of last resort” to keep interest rates from exploding. Long term, this confirms that the Fed cannot stop printing money. They are trapped. If they stop injecting cash, the gears grind to a halt.
5️⃣ Gold now outperforming the S&P 500 over the last 30 years

The chart above shows a massive shift. After lagging behind tech stocks for years, gold (the yellow line) has moved past the stock market (the blue line).
What this means: The market is voting with its wallet. When investors feel safe, they buy stocks (paper assets) that rely on growth and a stable economy. When investors are worried about the value of their money, they buy gold (hard assets). This crossover is not a fluke. It is a structural change. The market is realizing that corporate profits cannot keep up with the rate at which the government is devaluing the dollar.
Long-Term Insight: We are entering an era of “fiscal dominance.” This is when government debt is so high (over $36 trillion) that the only way to pay it is to print more money. Stocks might go up in nominal terms (the number gets bigger), but gold is going up faster because it is measuring the real loss of your purchasing power. This chart proves that the “risk-free” trade is no longer stocks; it is scarcity.
(3) Economic Outlook & Market Sentiment:
How do you cut through the noise and understand what’s really happening? The secret is to look at three different types of information: the feelings people, the actions of investors, and the facts about the economy. When you put them together, you get a clear picture.
1) Fear & Greed Analysis
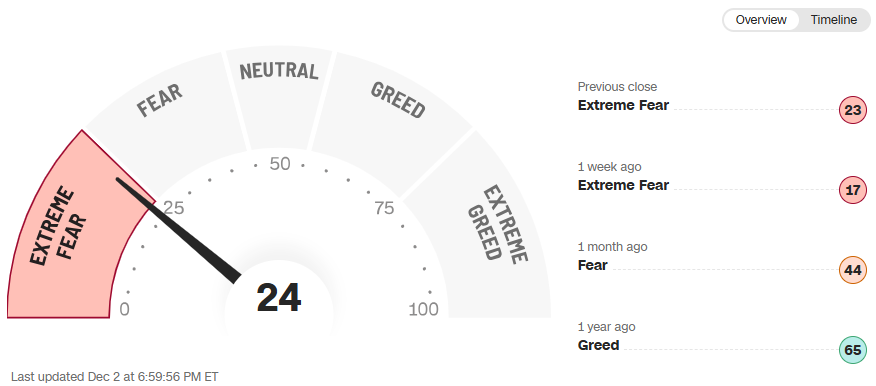
The current reading of 24 represents extreme fear and is deeply negative in the short term, but positive for contrarian investors.
The Fear & Greed Index combines seven different market measurements into one score from 0 to 100. Right now it’s at 24, meaning investors are panicking. A month ago it was at 17 (even worse).
What This Means
Here’s the counterintuitive truth about the Fear & Greed Index: extreme readings often signal turning points, not continuations.
When the index hits extreme fear (below 25), it means everyone who wanted to sell has probably already sold. There’s nobody left to panic. And when there’s nobody left to sell, the only direction is up.
Warren Buffett’s famous line captures this perfectly: “Be fearful when others are greedy and greedy when others are fearful.” Right now, others are fearful. That’s your signal.
2) AAII Investor Insights
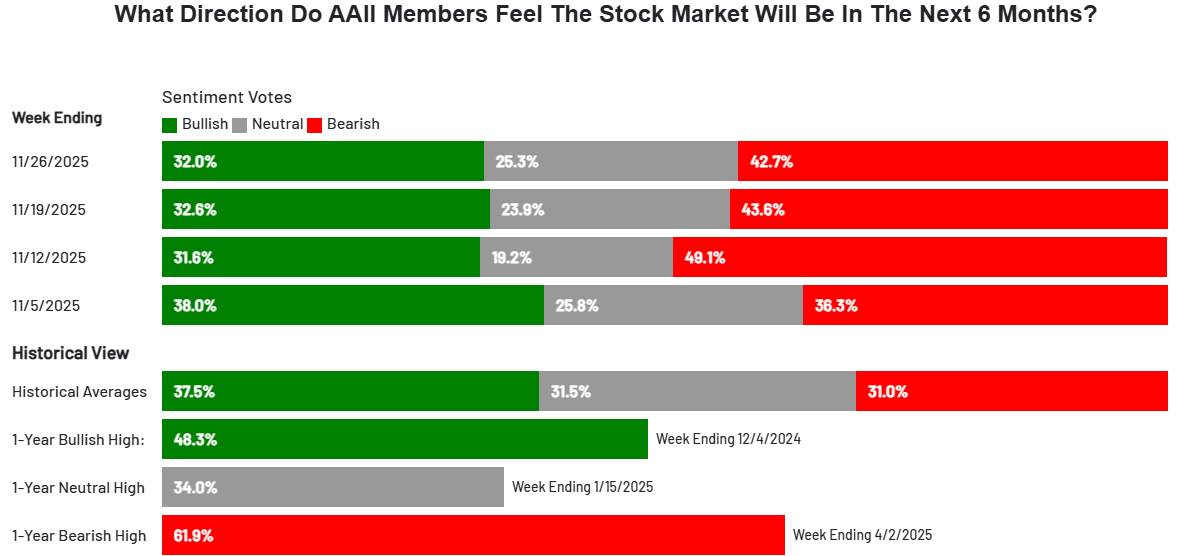
The AAII survey shows bearish sentiment at 42.7%, well above the historical average of 31%, which is a negative short-term signal but often marks market bottoms.
That bearish reading has been elevated for 51 of the past 53 weeks. Think about that. For an entire year, individual investors have been convinced stocks will fall. And yet, the market hasn’t collapsed.
Why Individual Investor Sentiment Matters
Here’s what 20 years of watching markets taught me: retail investors are usually right about the direction but wrong about the timing. And more importantly, they’re contrarian indicators at extremes.
When everyone’s bearish, it means:
Most people have already reduced their stock positions
Cash levels are high (future buying power)
Expectations are so low that any good news causes a surge
Translation: retail investors are scared of the very stocks that have been market leaders. When retail abandons winners, institutions often step in and buy.
The Pattern Repeats
During the 2022 bear market, the AAII bearish sentiment hit 60%. That marked the exact bottom. In March 2020 during COVID panic, bearish sentiment spiked to 70%. Two weeks later, the greatest bull run in history began.
Extreme pessimism among individuals often precedes market rallies because these investors have already positioned defensively. The selling is done. The fear is priced in. What’s left is upside surprise when things don’t collapse as expected.
3) Economic Indicator Analysis
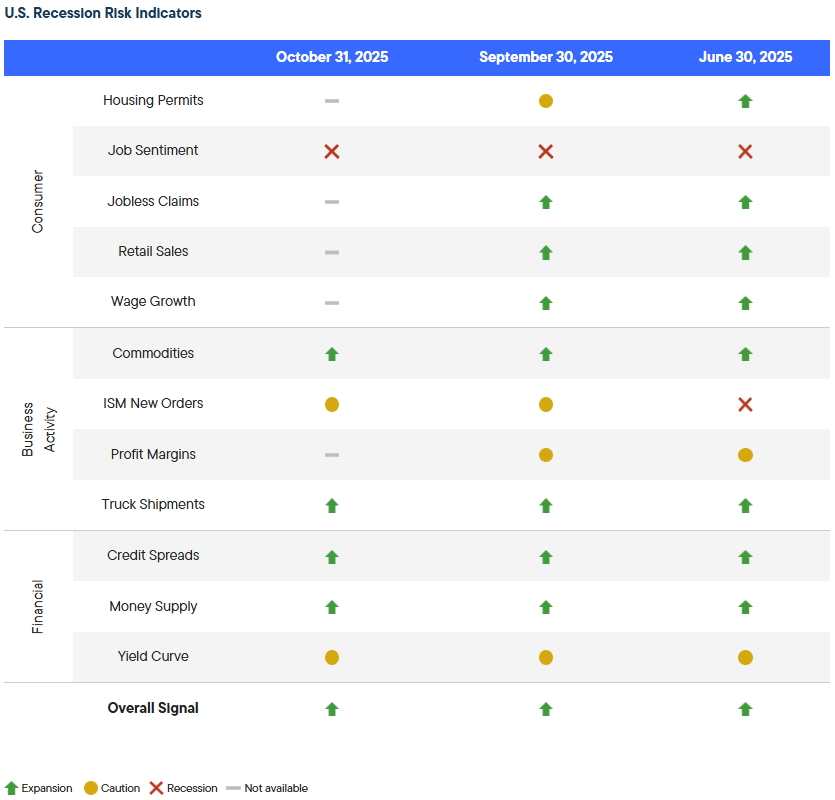
The overall recession risk signal reads “Expansion,” which is positive, though several individual indicators show caution, creating a mixed but generally constructive outlook.
What This Data Is Telling Us
Here’s the nuance most people miss: sentiment can be terrible while fundamentals remain solid. That’s exactly what’s happening now.
Job sentiment shows recession (people feel bad about employment). But actual jobless claims data isn’t available to confirm or deny that feeling. Retail sales, wage growth, and housing permits are also N/A, so we’re working with incomplete consumer data.
But look at the business and financial indicators:
Commodities are expanding (real economic activity is happening)
Truck shipments are expanding (goods are moving)
Credit spreads are tight (banks aren’t worried about defaults)
Money supply is growing (liquidity is ample)
Translation: the actual economy is functioning fine. People feel bad (sentiment), but the economic machine keeps running (fundamentals).
The two caution signals matter though:
ISM New Orders shows manufacturing demand is slowing
Yield Curve is inverted or flat (historically precedes recessions by 12-18 months)
So you have warning signs, but not emergency signals. Think of it like a yellow traffic light, not a red one.
4) What This All Means
The Fear & Greed Index (extreme fear) + AAII Sentiment (elevated bearish) + Recession Dashboard (expansion) = Classic contrarian setup.
Think about what this combination means:
Investors are terrified (sentiment)
They’ve positioned defensively (already sold)
But the economy hasn’t actually broken (fundamentals)
In my 15 years in finance, this pattern has repeated over and over. And almost every time, it marks a buying opportunity rather than a selling point.
The Psychology Behind the Disconnect
Human beings are wired to be terrible investors. We feel pain from losses twice as strongly as we feel pleasure from gains. So when markets get choppy, we overreact to the downside.
Right now, investors are looking at:
Elevated valuations in mega-cap tech (concentration risk)
Geopolitical uncertainty
Fed policy concerns
General late-cycle anxiety
And they’re saying: “This feels dangerous. I’m going to the sidelines.”
But here’s what they’re missing: all of those concerns are already reflected in current prices. When the Fear & Greed Index is at 24, it means those worries are priced in. When 43% of individual investors are bearish, it means defensive positioning is already done.
Historical Precedent
Let me give you a concrete example. In October 2022:
Fear & Greed Index: 25 (extreme fear)
AAII Bearish Sentiment: 60%+
Economic Indicators: Mixed (recession fears everywhere)
What happened next? The S&P 500 rallied 26% over the following six months.
Why? Because when everyone’s positioned for the worst and the worst doesn’t materialize, money flows back into risk assets fast.
The Truth
Most investors do the opposite of what works. They buy when everyone’s greedy (Fear & Greed at 80+) and sell when everyone’s fearful (Fear & Greed at 20-30).
Why? Because buying when you’re scared feels wrong. It feels reckless. Your brain is screaming: “Don’t catch a falling knife! Wait for confirmation!”
But here’s the thing about confirmation: by the time you get it, the opportunity is gone. When Fear & Greed rebounds to 60 and AAII sentiment turns bullish, stocks will already be 15-20% higher.
The investors who build real wealth are the ones who act when others freeze. They buy quality assets when they’re on sale, not when everyone agrees they’re safe.
A Story from 2008
During the financial crisis, I watched the Fear & Greed Index hit single digits. Absolute panic. AAII bearish sentiment was 70%+. Everyone was convinced the world was ending.
My own portfolio was down 40%. Every instinct said: “Get out. Preserve what’s left.”
But the economic indicators, despite all the fear, weren’t showing complete collapse. Credit markets were stabilizing (slowly). The Fed was injecting liquidity. The fundamentals, while damaged, weren’t as broken as sentiment suggested.
The investors who bought quality companies in Q1 2009 when everyone was terrified made generational wealth. Those who waited for the “all clear” signal bought back in after stocks had already doubled.
I’m not saying we’re in 2008 again. We’re not. But the pattern is familiar: extreme fear plus intact fundamentals equals opportunity.
The Most Important Thing to Remember
These three indicators (Fear & Greed, AAII Sentiment, Recession Dashboard) are most powerful when they diverge, not when they align.
When all three are negative: That’s a clear bear market. Stay defensive.
When all three are positive: That’s late-cycle euphoria. Take profits.
When sentiment is negative but fundamentals are positive: That’s a contrarian opportunity. That’s where we are now.
The market rewards those who can separate their emotions from their analysis. Fear & Greed at 24 is your emotion. Recession Dashboard at Expansion is your analysis.
Trade your analysis, not your emotion.
Final thought
Right now, the market is giving you a gift wrapped in anxiety. Investors are terrified. They’ve sold. They’re sitting on cash earning 4-5% while quality stocks sit 20-30% below their highs.
The economic fundamentals show expansion, not collapse. The recession indicators aren’t flashing red. The system is still working.
This divergence between perception and reality is where money gets made.
You can wait for confirmation. You can wait until Fear & Greed hits 60 and everyone feels good again. But by then, the opportunity will be gone.
Or you can do what successful investors have done for decades: buy fear, sell greed.
👉 For daily insights, follow me on X /Twitter; Instagram Threads; Facebook; or BlueSky, and turn on notifications!
(4) My stock picks, research, and analysis:
My core idea is simple: Invest in companies with unshakable competitive advantages that are also riding massive, long-term growth waves.
In this issue, we analyze:

(1) Dycom Industries
(2) Grab Holdings
(3) Meta Platforms
(4) American Express
(5) Final Thoughts
(1) Dycom Industries
Market cap: $10.4 billion. Forward P/E: 45. Up 93% in the last year. And they’re just getting started.
Dycom installs fiber optic networks. That’s it. That’s the business. And it’s exactly the business you want to own right now.
Why? Because AI doesn’t run on wireless networks. Every data center, every AI training facility, every edge computing node needs fiber optic cables connecting them. The bandwidth requirements for AI are orders of magnitude higher than previous computing generations.
Tertiary Benefit Strategy
Here’s the genius of this investment: Dycom benefits from AI regardless of whether AI actually works. Even if the AI boom busts, we still need more bandwidth for streaming, gaming, remote work, and everything else. Dycom is positioned at the intersection of multiple long-term trends.
The forward P/E of 45 is rich. No question. But compare it to pure AI plays at 60-100x earnings. You’re getting picks-and-shovels exposure at a relative discount to primary AI companies.
My plan
Buy in tranches. Put in 1/3 of your intended position now, 1/3 on any 10-15% dip, and keep 1/3 in reserve for a larger correction.
Time horizon: 5+ years. The fiber optic buildout will take a decade. You’re early to a long-term theme.
(2) Grab Holdings
Trading at $5.32 with a fair value estimate of $7.49. That’s a 29% discount to intrinsic value.
Grab is Southeast Asia’s super-app. Think Uber + DoorDash + PayPal all in one. They operate in Cambodia, Indonesia, Malaysia, Myanmar, Philippines, Singapore, Thailand, and Vietnam. Market cap: $21.74 billion.
Here’s the story that matters: Grab turned profitable. Net income of $96 million in the first nine months of 2025 compared to a loss last year. That’s the inflection point you want to catch.
Geographic Arbitrage Opportunity
When I worked at JP Morgan, we’d look for companies dominating fast-growing regions that US investors ignored. Southeast Asia is one of the fastest-growing digital economies on the planet. Internet penetration is rising. Mobile payment adoption is exploding. Middle class is expanding.
Grab is positioned as the dominant platform across multiple services in multiple countries. That network effect gets stronger with scale. Every new driver attracts more riders. Every new restaurant attracts more food delivery customers. Every transaction strengthens their payment network.
Autonomous Vehicle Catalyst
Grab’s strategic partnerships in autonomous vehicle technology could be huge. If self-driving cars become reality in the next 5-10 years, Grab’s platform doesn’t need to change. They just replace human drivers with autonomous vehicles and their margins expand dramatically.
Why it works
Southeast Asia is young, urban, and still underpenetrated in many services. As incomes rise, demand for delivery, digital payments, and small loans grows fast. Grab sits at the center of that flow.
My plan
This is a 5-10 year emerging markets position. Buy with money you won’t need to touch. Emerging markets are volatile, and Grab will have ups and downs.
(3) Meta Platforms
The stock dropped 18% because Meta’s spending more on AI. That’s exactly when you should be buying, not selling.
Meta reported monster numbers: revenue up 26% to $51 billion, earnings up 20%. But investors panicked when management announced higher AI spending for next year. This is the definition of short-term thinking destroying long-term value.
Here’s what the market’s missing: Meta is the second-largest adtech company in the world. Instagram and Facebook are money-printing machines. Every dollar Meta spends on AI improves user engagement and advertising outcomes. That’s not expense. That’s investment in a compounding moat.
The Two-Horizon Opportunity
Near-term (12-24 months): AI-powered ad targeting drives higher conversion rates. Advertisers pay more for better results. Meta’s revenue grows faster than costs. Margins expand.
Long-term (3-5 years): Smart glasses become mainstream. Meta already has 73% market share in this category. CEO Mark Zuckerberg believes these will be “primary computing devices” soon. If he’s even partially right, this becomes a second massive revenue stream beyond advertising.
The Valuation
Trading at 29x earnings with 16% annual earnings growth forecast means you’re paying 1.8x PEG ratio. That’s reasonable, not cheap. But compare it to Nvidia at 50x+ earnings or other AI pure plays at 60-80x. Meta gives you AI exposure with an actual profitable business model supporting it.
(This is crucial. So many AI companies are burning cash and hoping. Meta’s generating $51 billion in quarterly revenue while investing in AI.)
My plan
Buy Meta on any dip below $550. The 18% pullback from highs created an entry point. Set a 3-5 year time horizon minimum. This isn’t a trade. It’s a position in the dominant social media advertising platform that’s also building the next computing interface.

(4) American Express
When Warren Buffett owns more than 20% of a company and has held it for decades, you should probably pay attention.
American Express has something most financial companies don’t: a closed-loop network. They issue the card, run the payment network, and maintain the merchant relationship. That means they capture the full profit from every transaction, not just a slice.
This Matters More Than You Think
Most credit card companies rely on net interest income. When rates fluctuate or defaults rise, their profits swing wildly. American Express makes money on transaction volume and fees. That’s a more stable business model with less credit risk.
Their position with small and medium-sized businesses in America is nearly unassailable. These businesses don’t switch payment processors easily. There’s integration complexity, employee familiarity, and reward program benefits they’d lose.
Buffett’s Lesson
In my 20 years studying Buffett’s investments, I’ve noticed a pattern: he holds financial companies that have unique structural advantages, not just good management. American Express’s closed-loop network is that structural advantage.
The company survived the Great Depression, the 2008 financial crisis, and COVID. It’ll survive whatever comes next because its business model is antifragile. It gets stronger when competitors get weaker.
My plan
This is a buy-and-hold forever position. Don’t try to trade it. Don’t worry about short-term earnings misses. Accumulate it over time and let the moat do the work.
(5) Final Thoughts
These four investments share three common characteristics that create a unified investment thesis.
Pattern #1: Infrastructure Over Innovation
Three of these companies (Dycom, American Express, Grab) make money from infrastructure, not innovation. They’re not betting that some new technology works. They’re positioned to profit from people building out capacity regardless of which technology wins.
The lesson: When valuations are high and uncertainty is elevated, own the infrastructure companies. They have lower risk and more predictable cash flows than the companies trying to invent the future.
Pattern #2: The Valuation Arbitrage
Notice the P/E ratios:
Meta: 29x (vs pure AI plays at 60-100x)
Dycom: 45x (after doubling)
American Express: ~20x (mature financial)
Grab: Trading at 29% discount to fair value
You’re buying similar exposure to mega-trends (AI, digital payments) at 30-60% lower valuations than the headline companies everyone’s chasing.
This is how you generate alpha. Not by finding obscure companies nobody knows about. But by finding second-tier companies in first-tier industries trading at reasonable prices.
Pattern #3: The Multiple Revenue Stream Strategy
Look at each company:
Meta: Advertising + smart glasses + AI licensing (future)
American Express: Transaction fees + interest income + merchant services
Dycom: Fiber installation + network design + maintenance
Grab: Ride-sharing + food delivery + payments + autonomous vehicle platform
None of these companies rely on a single product or service. They’ve built platforms with multiple revenue streams. That diversification reduces risk while maintaining upside.
The Rebalancing Rules
Annually: Reassess the thesis. Has anything fundamentally changed? Are the growth rates materializing? Are competitive positions strengthening or weakening?
Event-driven: If any company announces a major acquisition, strategic pivot, or CEO change, reassess immediately. Don’t wait for the next quarterly review.
The Risk Management Framework
Position-level stops:
20% stop loss on Dycom (momentum plays)
30% stop loss on Grab (emerging market volatility)
No stops on Meta or American Express (long-term core holds)
Long-Term Wealth Creation
Here’s what this portfolio looks like in 5 years if the thesis plays out:
Meta successfully monetizes AI advertising improvements and smart glasses start generating meaningful revenue. Stock compounds at 20%+ annually. Your $10,000 becomes $24,900.
American Express steadily grows transaction volume, maintains pricing power, and continues dividend growth. Stock compounds at 10-12% annually. Your $10,000 becomes $16,100 plus $1,400 in cumulative dividends.
Dycom benefits from fiber optic expansion, compounds at 15-18% annually. Your $10,000 becomes $20,100.
Grab achieves consistent profitability, expands margins, and reaches fair value. Stock doubles. Your $10,000 becomes $20,000.
Compare that to buying the Nasdaq 100 at current valuations. You’d need the index to compound at 16.5% annually to match these returns. Possible? Sure. But you’re buying at peak valuations with concentration risk in mega-cap tech.
Final thought
Most investors are asking: “What’s the next Nvidia?” or “How do I get AI exposure?”
Those are the wrong questions.
The right question is: “How do I position for the infrastructure buildout that’s happening regardless of which technology wins?”
That’s what these stocks do. You’re not betting on AI being revolutionary. You’re betting on companies that profit from the capital expenditure cycle around AI. Even if AI disappoints, fiber optic networks still get installed and dgital payments still grow.
You win if the bull case plays out. And you don’t get killed if it doesn’t.
That asymmetry is how you build wealth that lasts. Not by swinging for home runs on speculative tech. But by owning quality infrastructure companies at reasonable valuations with multiple paths to victory.
These companies give you exactly that. Infrastructure over innovation. Value over hype. Multiple revenue streams over single-product risk.
👉 For daily insights, follow me on X /Twitter; Instagram Threads; Facebook; or BlueSky, and turn on notifications!
(5) Insider Trades from Billionaires, Politicians & CEOs:
When people with deep knowledge, such as politicians who set policy, executives who run the company, or legendary investors, put their own money on the line, it sends a powerful signal. You should pay attention.
This week, we analyze:

(1) Hyster-Yale Inc. $HY
(2) Vanguard U.S. Growth Fund VWUSX
(3) Bitwise Bitcoin ETF $BITB
(4) Fiserv Inc. $FISV
(5) Aurora Innovation Inc. $AUR
(6) Carrier Global Corporation $CARR
(7) Final thoughts
(1) Hyster-Yale Inc. $HY
Representative Tim Moore (Republican, North Carolina) made two purchases of Hyster-Yale Inc. $HY, a manufacturer of lift trucks and industrial equipment. Filed on December 2nd, he bought $50,000 to $100,000 worth at $35.63 per share. This followed an earlier purchase filed November 11th for the same dollar range at $29.77. That means Moore doubled down after his first position already gained 20% in just a few days.
Hyster-Yale $HY makes forklifts, lift trucks, and material handling equipment used in warehouses and distribution centers. With e-commerce and logistics infrastructure spending still elevated, the demand for this equipment remains strong. Moore sits on the House Appropriations Committee, giving him early insight into infrastructure spending and manufacturing incentives. When a Congressman buys the same industrial stock twice in a month, he’s not speculating. He knows something about upcoming policy that benefits manufacturing and logistics.
(2) Vanguard U.S. Growth Fund VWUSX
Senator Lindsey Graham (Republican, South Carolina) purchased $100,000 to $250,000 of Vanguard U.S. Growth Fund VWUSX on December 1st. Graham’s a senior member of the Senate Budget Committee and Senate Appropriations Committee. His bet on broad U.S. growth tells you he expects pro-business policies and economic expansion, not recession. This wasn’t a defensive move into bonds or cash. It was an aggressive allocation into growth stocks.
(3) Bitwise Bitcoin ETF $BITB
Senator Dave McCormick (Republican, Pennsylvania) bought $50,000 to $100,000 of Bitwise Bitcoin ETF $BITB at $48.45 per share on November 23rd (filed November 27th). McCormick sits on the Senate Banking Committee, which oversees crypto regulation. A Senator on the Banking Committee buying Bitcoin through an ETF signals he expects favorable regulatory treatment for crypto assets.
(4) Fiserv Inc. $FISV
Fiserv Inc. $FISV, a financial technology company providing payment processing and banking software, saw its CFO Todd Paul McFarland purchase $1,060,970 worth of stock at $62.41 per share on December 1st (filed December 2nd). He bought 17,000 shares, increasing his ownership by 228%. That’s conviction.
Fiserv processes payments for banks, merchants, and businesses worldwide. With digital payments growing and financial institutions modernizing their infrastructure, Fiserv sits at the center of a massive secular trend. When a CFO triples his position, he’s seen the quarterly numbers before anyone else. And those numbers are telling him the stock’s too cheap.
(5) Aurora Innovation Inc. $AUR
Aurora Innovation Inc. $AUR, a self-driving technology company, saw CEO Christopher Urmson buy $1,000,627 worth at $3.88 per share on November 25th (filed November 26th). He purchased 258,000 shares, increasing his stake by 5%. Aurora is developing autonomous trucking technology and recently announced commercial partnerships with FedEx and major freight carriers.
The CEO of an autonomous vehicle company buying a million dollars of stock at under $4 per share tells you he believes commercialization is closer than the market thinks. Self-driving trucks are no longer science fiction. They’re being tested on actual routes right now. Urmson’s seeing the progress firsthand.
(6) Carrier Global Corporation CARR 0.00%↑
Carrier Global Corporation $CARR, a provider of HVAC, refrigeration, and fire safety equipment, witnessed Chairman and CEO David L. Gitlin purchase $1,015,572 worth at $52.62 per share on November 25th (filed the same day). He bought 19,300 shares, increasing his holdings by 2%. Carrier supplies climate control systems to commercial buildings, data centers, and residential properties.
With data center construction exploding (they need massive cooling systems) and building electrification mandates spreading globally, Carrier’s positioned in multiple high-growth markets. When the Chairman/CEO buys over a million dollars of his own stock, he’s not worried about next quarter. He’s positioning for a multi-year run.
(7) Final thoughts
Here’s what these six trades reveal when you connect them:
Pattern #1: Infrastructure and Industrial Exposure
Moore bought Hyster-Yale (material handling equipment). Carrier makes HVAC for buildings and data centers. Fiserv processes digital payments (financial infrastructure). These aren’t sexy tech stocks. They’re the unglamorous infrastructure plays that benefit from massive capital expenditure cycles.
When I worked at JP Morgan, we’d watch insider buying patterns across sectors. When you see multiple insiders buying industrial and infrastructure names simultaneously, it signals they expect sustained economic activity and capital investment. Not recession. Not slowdown. Growth.
Pattern #2: The Technology Infrastructure Play
Aurora (autonomous vehicles) and Fiserv (payment processing) represent the digital infrastructure layer. Bitcoin ETF exposure shows belief in digital assets as legitimate financial infrastructure. These aren’t speculative moonshots. They’re bets on technologies transitioning from experimental to essential.
The common thread: these insiders believe we’re entering a phase where digital and physical infrastructure both get massive investment.
Pattern #3: Broad Market Confidence
Graham’s purchase of a U.S. growth fund is the tell. He’s not picking individual stocks or making sector bets. He’s saying the entire U.S. equity market is positioned for growth. When a Senator with budget and appropriations oversight makes that bet, you pay attention.
The Truth About Insider Trades
Most investors ignore congressional stock trades because they assume politicians are corrupt or uninformed. Both assumptions miss the point.
Yes, some politicians trade on inside information. But the valuable signal isn’t “they’re cheating.” It’s “they have access to information we don’t.”
Graham buying a growth fund tells you he expects pro-growth policy. He doesn’t need inside information about Apple’s earnings. He needs to know what legislation is coming and how it’ll impact markets. And he knows because he helps write it.
McCormick buying Bitcoin ETF tells you crypto regulation will be favorable. He’s on the Banking Committee. He sees the draft legislation before it’s public.
Moore buying industrial equipment manufacturers tells you infrastructure spending will continue. He sits on Appropriations. He knows where the money’s going.
This isn’t insider trading in the illegal sense. It’s position-based information advantage.
During the 2008 financial crisis, executives at Goldman Sachs, JPMorgan, and other banks stopped buying their own stocks in summer 2007. They knew the subprime mortgage market was collapsing. By the time the public figured it out, it was too late.
In early 2020, several senators sold stocks in late January and February before COVID crashed markets. They’d attended classified briefings about the pandemic’s potential impact.
Insider trading, legal or not, is the most reliable signal in markets. These people know more than you. When they put their own money on the line, you should pay attention.
Right now, in December 2025, we’re seeing executives buy industrial infrastructure, payment processing, autonomous vehicles, and broad market growth funds. That’s not a defensive positioning. That’s a bet on acceleration.
(6) Top 5 Stocks this Week:
Hedge Fund’s Biggest Bets. Here are the stocks making millionaires:
(1) Kohl’s $KSS up +43% on 11/26
(2) Symbotic $SYM up +35% on 11/25
(3) MongoDB $MDB up +24% on 12/2
(4) Arrowhead Pharmaceuticals $ARWR up +19% on 11/26
(5) Credo Technology $CRDO up +16% on 12/2
(6) Final thoughts
(1) Kohl’s $KSS up +43% on 11/26
Kohl’s $KSS exploded up 43% after third-quarter earnings crushed expectations so thoroughly that Wall Street had to completely reassess the department store’s future. The company reported adjusted earnings of 10 cents per share versus expectations of a 20-cent loss. That’s not just a beat. That’s a complete reversal of the narrative. Revenue hit $3.41 billion, topping the $3.32 billion consensus. The stock added another 7% the following day as investors who missed the initial surge piled in.
Here’s why this matters: when a retailer everyone thinks is dying suddenly posts a profit instead of an expected loss, it signals that management fixed something structural. Cost cuts are working. Inventory management improved. Customer traffic stabilized. This wasn’t luck. This was execution. And the market rewarded that execution with a near-doubling of market cap in 48 hours.
The lesson: heavily shorted stocks with low expectations can produce the biggest gains when they simply deliver decent results. Kohl’s proves that sometimes the best opportunities hide in stocks everyone’s given up on.
(2) Symbotic $SYM up +35% on 11/25
Symbotic $SYM, a robotics and automation company, surged 35% on fiscal fourth-quarter revenue of $618 million versus analyst expectations of $604 million. The company builds AI-powered warehouse automation systems that help retailers and distributors move products faster and cheaper. With e-commerce still growing and labor costs rising, Symbotic’s technology becomes more valuable every quarter.
The stock’s move up reflects something bigger than one earnings beat: the market’s finally pricing in the multi-year warehouse automation buildout that’s just beginning. Walmart, Target, and other major retailers need these systems to compete with Amazon’s logistics efficiency. Symbotic’s positioned as one of the primary suppliers of this infrastructure.
When I worked on Wall St., we’d watch for stocks that doubled revenue in 2-3 years while improving margins. Those are the compounders that create generational wealth. Symbotic’s on that trajectory. The 35% pop was the market catching up to that reality all at once.
(3) MongoDB $MDB up +24% on 12/2
MongoDB $MDB, a developer data platform company, soared 24% after reporting third-quarter adjusted earnings of $1.32 per share on revenue of $628 million. Analysts expected just 80 cents per share on $592 million in revenue. The company also raised full fiscal year guidance, signaling accelerating business momentum.
MongoDB’s database technology powers modern applications and AI systems. As companies build more AI-powered products, they need flexible, scalable databases. MongoDB’s positioned as critical infrastructure for the AI buildout everyone’s talking about. The earnings beat confirms that enterprise spending on AI infrastructure isn’t just hype. It’s real, measurable revenue.
The pattern: when infrastructure software companies beat estimates by 65% (like MongoDB did on earnings), it means demand’s exceeding even optimistic forecasts. That’s the signal to either initiate or add to positions before the next quarter proves it wasn’t a fluke.
(4) Arrowhead Pharmaceuticals $ARWR up +19% on 11/26
Arrowhead Pharmaceuticals $ARWR popped 19% after reporting fiscal year revenue of $829.4 million, beating analyst expectations of $861.2 million (wait, that’s actually a miss on revenue). But here’s what mattered: the company announced it created the first and only FDA-approved medicine to treat familial chylomicronemia syndrome complications. That FDA approval is worth far more than one quarter’s revenue beat or miss.
In biotech, FDA approvals are binary events that can make or break companies. When a small biotech gets FDA approval for a first-in-class treatment, the addressable market and revenue potential expands dramatically. The 19% move reflects the market repricing Arrowhead’s future based on this new approved product.
The lesson: in biotech investing, focus on pipeline catalysts (FDA decisions, trial results) more than quarterly earnings. A single approval can create more value than years of incremental revenue growth.
(5) Credo Technology $CRDO up +16% on 12/2
Credo Technology $CRDO, a manufacturer of cables and chips used in AI computers, rose 16% on fiscal second-quarter adjusted earnings of 67 cents per share (versus 49 cents expected) and revenue of $268 million (versus $235 million expected). But here’s the real story: Credo forecast current-quarter revenue of $335-345 million while analysts expected just $248 million. That’s a 35-40% upside surprise on guidance.
Credo makes the physical connectivity infrastructure that AI data centers need. As hyperscalers build more AI training facilities, they need more high-speed cables and interconnects. Credo’s guidance implies order books are full for at least the next two quarters. This is the picks-and-shovels AI infrastructure play that many investors miss while chasing headline AI stocks.
(6) Final thoughts
These stocks averaging 15%+ gains in single sessions prove something fundamental: the market doesn’t price in earnings beats ahead of time as efficiently as academics claim.
If markets were perfectly efficient, Kohl’s wouldn’t jump 43% on results. It would’ve gradually priced in the improvement over preceding weeks. But it doesn’t work that way. Information takes time to disseminate and even longer for capital to reposition.
That lag is your edge. When you do the research others skip, when you track insider buying others ignore, when you notice analyst revisions others dismiss, you position yourself ahead of these 15-40% single-day moves.
Most investors will read this list and think: “I missed these opportunities.” The smart ones will think: “What patterns do these share that I can identify before the next earnings season?”
👉 For daily insights, follow me on X /Twitter; Instagram Threads; Facebook; or BlueSky, and turn on notifications!
(7) Trade of the Week:
The options market is where the smartest traders place their biggest bets. I monitor options flow activity daily. Here’s my play this week:
Teladoc Health TDOC 0.00%↑
Normally, for every person betting a stock will go up, there is someone betting it will go down. It balances out. But right now, for Teladoc Health $TDOC, the ratio is 20 to 1 in favor of the bulls.
Traders are piling into Call Options. In plain English, a Call Option is a contract that gives you the right to buy a stock at a set price. It is a bet that the price will go up.
Here are the exact details of the bet:
The Contract: December 5th Call Option with an $8.00 “Strike Price.”
The Price: They paid between $0.03 and $0.08 per contract.
The Volume: 17,619 contracts were traded.
The Context: There were only 1,770 contracts open before this. This means 90% of this activity is brand new money entering the market today.
What This Means
The stock is currently trading around $7.45. These traders are betting that by December 5th (just a few days away), the stock will jump above $8.00.
They are buying “cheap lottery tickets.” At $0.05 a contract, the risk is tiny. But if the stock jumps to $8.50 or $9.00, those 5-cent contracts could be worth 50 cents or a dollar. That is a 1,000% return in a week.
The Story
To understand this trade is shocking, you have to look at the history.
During the pandemic, Teladoc was the king of the market. It traded near $300 a share. Everyone stayed home, and everyone saw their doctor on an iPad. But then the world reopened. Competition flooded in. Teladoc crashed from $300 down to $7. It lost 97% of its value.
Most investors look at that chart and see a disaster.
When a stock is beaten down this badly, it doesn’t take much to make it jump. A simplified earnings report, a rumor of a buyout, or just a little bit of good news can send the stock flying because there are no sellers left. The “smart money” buying these calls likely believes that Teladoc is oversold and due for a violent bounce back.
Following the “Whales”
I am bullish on this specific trade setup, but with a warning.
This is not “investing.” This is speculation. The traders buying these contracts are not looking at the 10-year business plan. They are playing a short-term momentum shift.
This is a classic “Asymmetric Bet.” The traders are risking pennies to make dollars. If Teladoc stays at $7.45, they lose their 5 cents. Who cares? But if Teladoc announces good news, they make a fortune.
When you see volume explode like this (17,000 contracts vs 1,000 open interest), it usually means an institution knows something we don’t. They are positioning themselves before the news drops.
(8) 5 Stocks to Watch (Earnings this Week):
Here’s what you need to know for the most important earnings this week:
 HAFNIA Tuesday Before Opeл After Close Most Anticipated Earnings Releases December 01, 2025 CREDO VRVL S Scotiabank Wednesday Before Open After Close MARVELL mongoDB PDOLLAR Thursday Before Open SIGNET SILE GitLab salesfarce Close 3+SimulaciansPlus SNUN Friday Before Open *macys UNFI DorU DocuSign 茶snowlaka CANCO畑音 CROWOSTRIKE MOneyHero RBC SEKK rubrik PURESTORAGE vestis Y300 VICTORIA'S SECRET PFintech 營虎證芬 sprinklr Sentnelona UiPath KNOT Hormel five BELW ULTA, UWHE GUIDEWIRE -chargepoin+ box 4SAN HealthEquity CIBC SAE SAIC samsara asana Hewlett Packard 00ρς DESCARTES LESLIES http://eps.sh/cal Bank PVH Donaldson. TILLYS Argan, Inc. SPORTSMANSI Whispers'")
Salesforce - The cloud software giant (market cap ~$300 billion) is the king jewel of enterprise software, providing customer relationship management tools to businesses worldwide. The bull case hinges on AI integration driving higher subscription prices and expanding margins, while the bear case centers on slowing enterprise spending and competition from Microsoft.
Salesforce announced aggressive cost cuts and committed to $10 billion in stock buybacks, signaling management confidence. Watch for subscription revenue growth (needs to be 10%+ to maintain momentum), operating margin expansion (target is 30%+), and AI product adoption metrics.
My take: Salesforce is positioned well if they can prove AI features justify premium pricing, but any guidance miss will be punished given the stock’s already-rich valuation around 30x earnings.

Marvell Technology - This $80 billion semiconductor company designs chips for data centers, 5G infrastructure, and AI applications. Bull case centers on explosive AI chip demand as hyperscalers build data centers, with Marvell’s custom chip business for clients like Amazon and Google growing triple digits year-over-year. Bear case worries about over-investment in AI infrastructure and potential demand slowdown if the AI buildout pauses.
Marvell’s been winning major design wins with cloud providers for custom AI accelerators. Watch for data center revenue growth (should be 50%+ to justify valuation), guidance for next quarter’s custom chip shipments, and any comments on customer order patterns. This is a pure AI infrastructure play with real revenue, not just promises.
Snowflake - The $50 billion cloud data warehouse company helps businesses store and analyze massive amounts of data. Bull case relies on AI workloads driving explosive data storage and processing demand, as companies need Snowflake’s platform to handle the data requirements for training and running AI models. Bear case focuses on competition from Databricks and concerns about consumption-based revenue volatility.
CEO change earlier this year raised questions about execution, but the company’s been beating estimates consistently. Watch for product revenue growth (needs 30%+ to maintain premium valuation), net revenue retention rate (should stay above 120%), and AI-related workload growth commentary.
My view: Snowflake’s positioned perfectly for the AI data explosion, but at 15x sales, there’s no room for error.

MongoDB - This $25 billion database platform company provides flexible, scalable databases for modern applications and AI systems. The bull case centers on MongoDB being critical infrastructure for AI application development, with every company building AI products needing databases like MongoDB’s. Bear case worries about larger competitors like Amazon and Microsoft offering database services at lower prices.
MongoDB’s Atlas database-as-a-service product has been growing 40%+ annually, and AI application development is accelerating adoption. Watch for Atlas revenue growth (needs to stay above 35%), customer acquisition trends, and any commentary on AI-driven database demand. My take: MongoDB already reported and beat massively (as we saw in the earlier section with a 24% stock pop), proving the AI database thesis is real. This validates the entire sector.
UiPath - The $15 billion robotic process automation company helps businesses automate repetitive tasks. Bull case centers on AI making automation more intelligent and capable, expanding UiPath’s addressable market from simple task automation to complex workflow automation. Bear case worries that generative AI might replace UiPath’s automation platform entirely, making their technology obsolete.
UiPath’s been integrating AI capabilities into its platform to stay relevant as automation evolves. Watch for annual recurring revenue growth (needs 20%+ to show momentum), customer retention rates, and commentary on AI’s impact on their business (helpful or harmful?). If UiPath proves AI enhances their platform, the stock rallies. If AI threatens their model, it drops. High stakes, unclear outcome.


👉 For daily insights, follow me on X /Twitter; Instagram Threads; Facebook; or BlueSky, and turn on notifications!
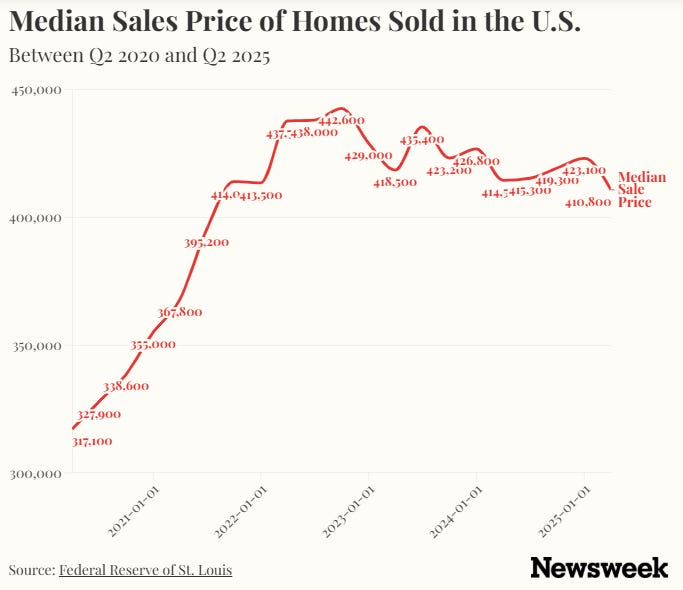
(9) Real Estate Market Analytics:
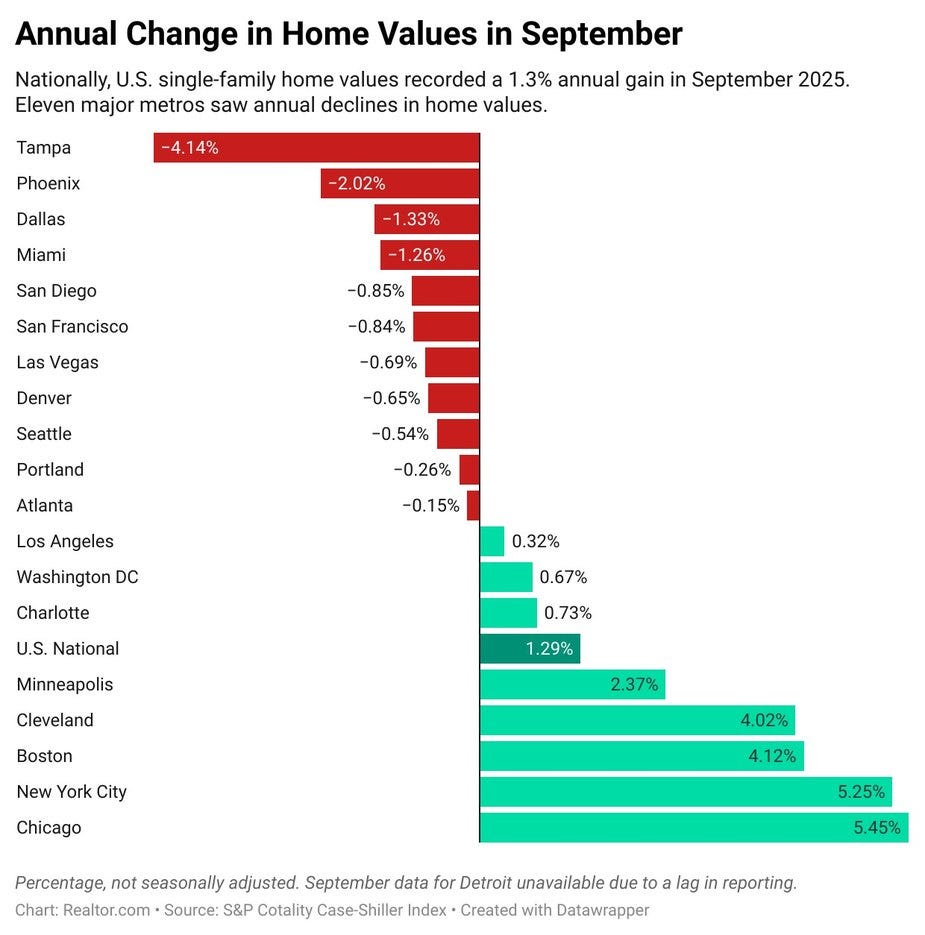
For the first time since 2023, more than half of America’s major cities are watching home prices drop year-over-year. According to the S&P Case-Shiller Index released November 25, 2025, 11 of 20 major metros recorded negative annual price growth. Yet home sales remain near 30-year lows. And here’s the part nobody’s talking about: this isn’t the crash everyone’s been predicting. It’s something far more interesting.
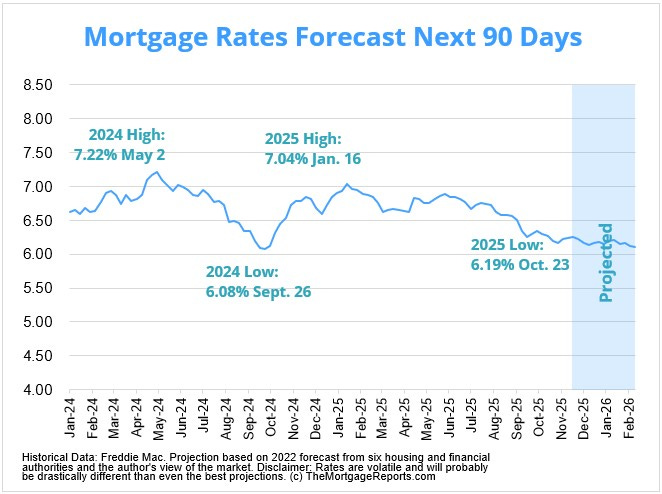
The housing market is stuck in limbo between two worlds. Mortgage rates hit 6.26% in the week ending November 22nd (the lowest in over a year), yet existing-home sales crawled to just 4.1 million annual pace. Inventory climbed 12% year-over-year to 1.06 million homes. Median listing prices fell 1.2% compared to a year ago, marking the 12th consecutive week of decline on a price-per-square-foot basis.
Tampa home prices dropped 4.14% year-over-year. Phoenix fell 2.02%. Cape Coral declined 10.2%. Yet these same markets saw prices surge 55%+ over the previous five years. Translation: prices aren’t crashing. They’re adjusting from insane to merely expensive.
Meanwhile, the Realtor.com 2026 forecast (released December 2, 2025) projects mortgage rates averaging 6.3%, home prices rising 2.2%, and existing-home sales increasing just 1.7% to 4.13 million. That’s barely above the 29-year low set in 2024.
Here’s the truth: we’re not in a buyer’s market or a seller’s market. We’re in the first balanced market in nine years. And nobody knows how to navigate it because an entire generation of agents, buyers, and sellers only experienced the feeding frenzy of 2020-2023.
What “Balanced” Actually Means
When I analyzed markets at JPMorgan, we used a simple metric: months of supply. Under 4 months = seller’s market. Over 6 months = buyer’s market. Between 4-6 months = balanced.
The national market hit 4.6 months of supply as of November 2025 and is projected to stay there through 2026. That’s the definition of balanced. But here’s what balanced really means for you:
For buyers: You finally have negotiating power. Homes are sitting on the market 2 days longer than a year ago. Price cuts are accelerating (down 1.2% year-over-year nationally, with some metros down 10%+). You’re not competing against 15 other offers anymore.
For sellers: You can’t just list at any price and expect multiple bids. In 2025, an increasing number of sellers delisted their homes rather than accept disappointing offers. That trend continues in 2026.
For investors: The spread between cap rates and mortgage rates finally makes sense again in select markets. But you need to pick the right metros because this isn’t a national story anymore. It’s 100 local stories.
The Lesson: Markets Revert, Psychology Doesn’t
Here’s what 20 years analyzing real estate markets taught me: housing markets always revert to the mean. But human behavior never does.
In 2021-2022, buyers panicked and overpaid because they feared being priced out forever. They extrapolated recent trends infinitely forward. Homes that sold for $300,000 in 2019 sold for $450,000 in 2022. Buyers assumed $600,000 by 2025.
Instead, those same homes are now worth $425,000 (down 5.5% from peak but still up 40% from 2019).
In 2025-2026, sellers are making the opposite mistake. They’re anchored to 2022 peak prices and refusing to accept current market reality. That’s why we saw record delistings in 2025. Sellers would rather not sell than “lose money” to an artificial peak.
Both behaviors are predictable. Both are wrong. And both create opportunity for those who think differently.
Competitive Advantage in 2026
The buyers who win in 2026 aren’t the ones with the most money. They’re the ones with the most patience and the least emotional attachment to outcomes.
The November 22, 2025 data showed the market exactly where it’ll be through most of 2026: balanced, slow, improving gradually. Not exciting. Not scary. Just normal.
And “normal” is the best market for rational actors. You can negotiate. You can walk away. You can take months finding the right property. You’re not competing against 20 other bidders or watching prices surge 2% per month.
The December 2, 2025 forecast confirms this: sales up just 1.7%, prices up just 2.2%, inventory up 8.9%. Steady. Predictable. Boring.
Boring is where wealth gets built.
Three Options for 2026
Option #1: Buy in Q1 2026 (January-March)
The data supports this if you’re ready. Inventory peaks in summer but price cuts peak in winter. The 2026 forecast shows prices rising 2.2% across the year. That means Q1 offers best value before spring bump.
Who this fits: First-time buyers in markets with declining prices (Tampa, Phoenix, Denver, Sacramento). Move-up buyers who’ve solved the rate lock-in problem. Investors deploying capital in high-demand rental markets.
Option #2: Wait Until 2027
The forecast shows slow improvement, not dramatic change. If you’re not ready financially or emotionally, another year won’t hurt you. Prices rise 2.2% in 2026 (less than inflation). Inventory continues growing. Mortgage rates might drop further if Fed cuts continue.
Who this fits: Renters in expensive markets where buying doesn’t make financial sense on a 5-year timeline. Sellers anchored to higher prices who’d rather keep their low-rate mortgage. Anyone with job uncertainty or life changes pending.
Option #3: Rent and Invest the Difference
This is the option nobody talks about but often makes the most sense. With rents falling 1.0% in 2026 and home prices rising 2.2%, the rent-vs-buy gap is narrowing. But in many markets, renting still wins financially if you invest the savings.
Example: Renting costs $2,000/month. Buying (with mortgage, taxes, insurance, maintenance) costs $3,000/month. That’s $12,000 annual savings. Invested at 8% annual return over 5 years becomes $73,000. Even if the home appreciates 2.2% annually, you’d need $550,000 home value to generate $73,000 equity (excluding closing costs).
Who this fits: High-income professionals in expensive cities. Young adults maximizing flexibility. Investors who’d rather deploy capital in stocks/businesses than real estate.
Final thought
The housing market as of December 2025 isn’t the crash pessimists predicted or the recovery optimists hoped for. It’s the normalization nobody prepared for.
Mortgage rates around 6.26% (November 22, 2025 data). Home prices down 1.2% nationally with 11 of 20 major metros showing annual declines. Inventory up 12%. Sales still near 30-year lows. Forecast for 2026: more of the same with modest improvements.
This isn’t exciting. But it’s actionable. You have time. You have options. You have negotiating power if you’re a buyer or financial cushion if you’re a seller who can wait.
The question isn’t whether to participate in the housing market. The question is how to participate intelligently given current conditions.
Real estate is still local. And your optimal move depends on where you are, where you’re going, and how long you plan to stay.
👉 For daily insights, follow me on X /Twitter; Instagram Threads; Facebook; or BlueSky, and turn on notifications!
(10) Interest Rate Predictions:
Mortgage rates are going to stay flat. Do not expect any massive drops or sudden spikes this week. We are likely stuck near the current 6.25% range.
Here is why the market is frozen:
The “Fed” Watch: Everyone is terrified to make a move until the Federal Reserve (the “Fed”) gives clear directions on their next interest rate decision. Lenders are playing it safe until they know the game plan.
The December Lull: This happens every year. Many traders and bankers take time off in December. When fewer people are trading bonds, the market gets quiet. It might feel a little bumpy day-to-day, but the overall trend is going nowhere.
The Data Standoff: We are seeing mixed signals. Inflation is cooling down (which is good), but the job market is getting softer (which is worrying). These two forces are canceling each other out, keeping rates stuck in the middle.
Advice
1. For Home Buyers: The “Float Down” Strategy
What to do: Lock in your rate now, but ask for a “float down” option.
How to implement:
Call your lender today.
Ask: “If I lock my rate today, do you offer a one-time ‘float down’ if rates drop by 0.25% before we close?”
If they say yes, lock the rate. You are protected if rates go up (because you locked), but you win if rates go down (because you float down). It is a win-win.
2. For Sellers: The “30-Day” Rule
What to do: Price your home based strictly on sales from the last 30 days, not 3 months ago.
How to implement:
Look at the “comps” (comparable homes) your agent gives you.
Throw away anything older than 30 days.
Price your home 2% below the most recent sale. In a flat market, being the best value is the only way to get a bidding war.
3. For Investors: The “Cash Flow” Test
What to do: Stop betting on “appreciation” (the house value going up) and focus entirely on “cash flow” (monthly profit).
How to implement:
Use the 1% Rule as a quick filter. Does the monthly rent equal roughly 1% of the purchase price? (e.g., $200,000 house rents for $2,000).
If the answer is no, run the numbers again with a 6.5% interest rate.
If the property does not put cash in your pocket today, do not buy it. Stability in rates often means stability in prices, so your profit must come from rent, not resale.
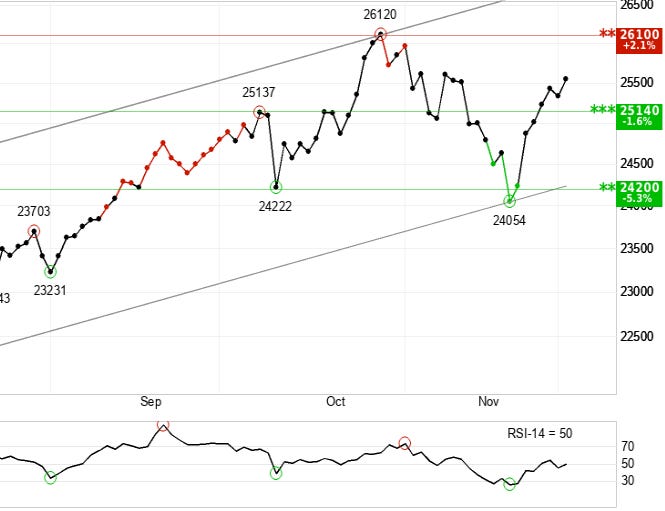
(11) Technical Analysis (S&P 500, Tech, Bitcoin):
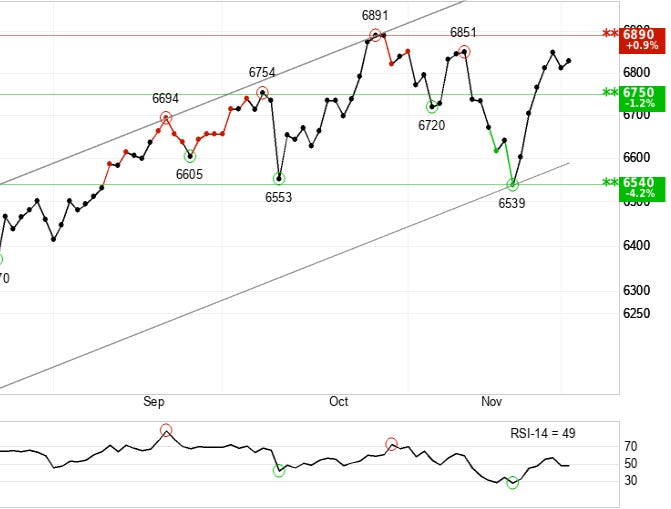
1) S&P 500 SPY 0.00%↑ (Short-term)
The trend is weak positive, meaning the S&P 500 is rising but without strong conviction.
Investors are paying higher prices over time, but they’re doing it nervously. The rising trend channel shows a pattern where each low is higher than the previous low, and each high is higher than the previous high. That’s textbook uptrend behavior. But the “weak” designation tells you momentum is fading.
December historically sees the S&P 500 rise 72% of the time (the best monthly win rate all year). We’re in the beginning of that window. Corporate earnings have been solid. The Fed’s expected to cut rates again. But volume has been declining on up days, which means fewer participants are driving the rally.
That declining volume is the warning sign. When prices rise but volume falls, it’s like a car climbing a hill in a higher gear with less gas. You’re still moving up, but you’re working harder for each inch of progress.
2) Tech Stocks QQQ 0.00%↑ (Short-term)
The trend is weak positive, mirroring the S&P 500’s cautious advance.
The Nasdaq shows the same pattern as the S&P: rising prices, rising trend channel, but declining conviction. The 22-day performance is actually negative (-0.70%), meaning the index is lower than it was 3 weeks ago despite being in an “uptrend.” That’s the definition of a consolidation phase within a longer-term uptrend.
The Nasdaq is up 7.81% over the past 66 days (about 3 months), almost entirely driven by AI-related stocks. But in the past 22 days, it’s given back ground. Why? Because the market’s questioning whether AI spending justifies current valuations.
We saw Nvidia, Microsoft, and other tech giants report strong earnings in late November, but guidance was cautious. That created this weird dynamic: fundamentals are solid, but expectations got ahead of reality. The Nasdaq is now in the “prove it” phase where investors need to see continued AI monetization before bidding prices higher.
The volatility number tells the story: 17.52% over 66 days. That’s elevated volatility for an index in an uptrend. High volatility + weak momentum = market trying to decide its next major move.
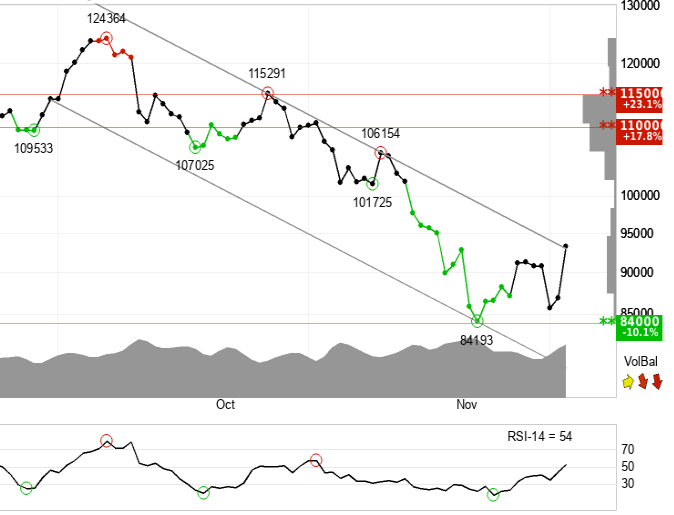
3) Bitcoin $BTC (Short-term)
The trend is negative, and this is the most important signal of the three.
Bitcoin broke out of a falling trend channel (which should be bullish), but volume was weak and volume balance is deeply negative. Over the past 22 days, Bitcoin is down 11.67%. Over the past 66 days, down 14.74%. The recent rally is a bounce within a larger downtrend, not a reversal.
The pattern is clear: volume spikes on down days (everyone selling), volume dries up on up days (nobody buying). That’s the signature of a bear market rally. Weak hands selling into every bounce. Strong hands waiting for lower prices.
If Bitcoin breaks $84,000, the next stop is likely $70,000-75,000. That’s where the chart shows the next significant support level.
(12) 3 Important Events this Week:
1) Friday, December 6: PCE Inflation Data
This is the single most important release of the week. The Personal Consumption Expenditures (PCE) index is the Fed’s preferred inflation gauge, and December’s rate decision hinges entirely on this number. If inflation’s cooling, the Fed cuts rates and stocks rally. If inflation’s sticky, the Fed pauses and markets sell off.
Here’s why PCE matters more than CPI (Consumer Price Index): PCE captures actual spending behavior, not just price changes. When people substitute chicken for beef because beef got expensive, CPI misses that shift. PCE catches it.
2) Wednesday, December 4: November ISM Non-Manufacturing PMI
Services are 80% of the U.S. economy, which makes this the most comprehensive snapshot of economic health you’ll get this week. The ISM Non-Manufacturing PMI (also called Services PMI) surveys purchasing managers across healthcare, retail, finance, hospitality, and everything else that isn’t manufacturing. A reading above 50 means the sector’s expanding. Below 50 means contraction.
October’s reading came in at 56.0, showing strong growth. If November stays above 54, it confirms the economy’s still expanding and stocks can continue higher. If it drops below 52, it signals momentum’s fading and the Fed has room to cut rates more aggressively (which could actually be bullish short-term).
3) Wednesday, December 4: November ADP Nonfarm Employment
ADP tracks private sector hiring across 25 million employees, making it the largest real-time employment dataset outside the government. When ADP beats expectations, the official jobs report usually follows. When ADP disappoints, trouble’s brewing.
October’s ADP report shocked at negative 32,000 jobs (yes, negative), the first contraction since 2020. That sent shockwaves through markets because it suggested the labor market’s cracking. November’s ADP is expected to rebound to around 100,000-150,000. If it comes in positive and beats estimates, it confirms October was a fluke (hurricanes and strikes distorted the data). If it disappoints again, the Fed has a serious problem.
👋Final Thoughts:
🙌Thanks for reading and joining 108,000 members who trust our newsletter! If you enjoyed it please:
Help us by sharing it with friends or family to help us grow our audience, and become a paid subscriber to support our writing and research (learn about all of the benefits here):
Hit the LIKE button ❤️ on this post to help us grow our audience on Substack 🙏
Did you know that your job can pay for this newsletter with its employee development budget? To make the process easy, we’ve created this email template to send to your manager.
Missed an issue? Read past issues here at TheFinanceNewsletter.com
☺️ My goal is to help you become smarter with money — Join 3 million and follow me across social media for daily insights:
Instagram Threads: @Fluent.In.Finance
Twitter/ X: @FluentInFinance
Facebook Page: Facebook.com/FluentInFinance
Linkedin: Linkedin.com/in/Lokenauth
Youtube: Youtube.com/FluentInFinance
Instagram: @Fluent.In.Finance
TikTok: @FluentInFinance
Facebook Group: Facebook.com/Groups/FinanceTalk
Reddit Community: r/FluentInFinance
➕Please add this newsletter to your contacts to ensure that none of our emails ever go to spam!
This content is for educational purposes only. Such information should not be construed as legal, tax, investment, financial, or other advice. See for Disclaimer, Terms and Conditions.
Excellent breakdown here. The Black Friday insight about fewer items at higher prices really caught my attention because that's not just inflation, it's a quality shift that changes which companies win. The connection between Fed rate cuts and forced courage makes total sense too. When cash pays less, sitting on the sidelines becomes riskier than investing, which is the opposite of how most people think about it.