

💥 Recession Odds Rise to 49%, Interest Rates May Rise Again, and This Oil Shock May Last for Years
Recession odds near 50%, private credit is showing the same warning signs from 2008, and the market shift ahead. Here's what to do.

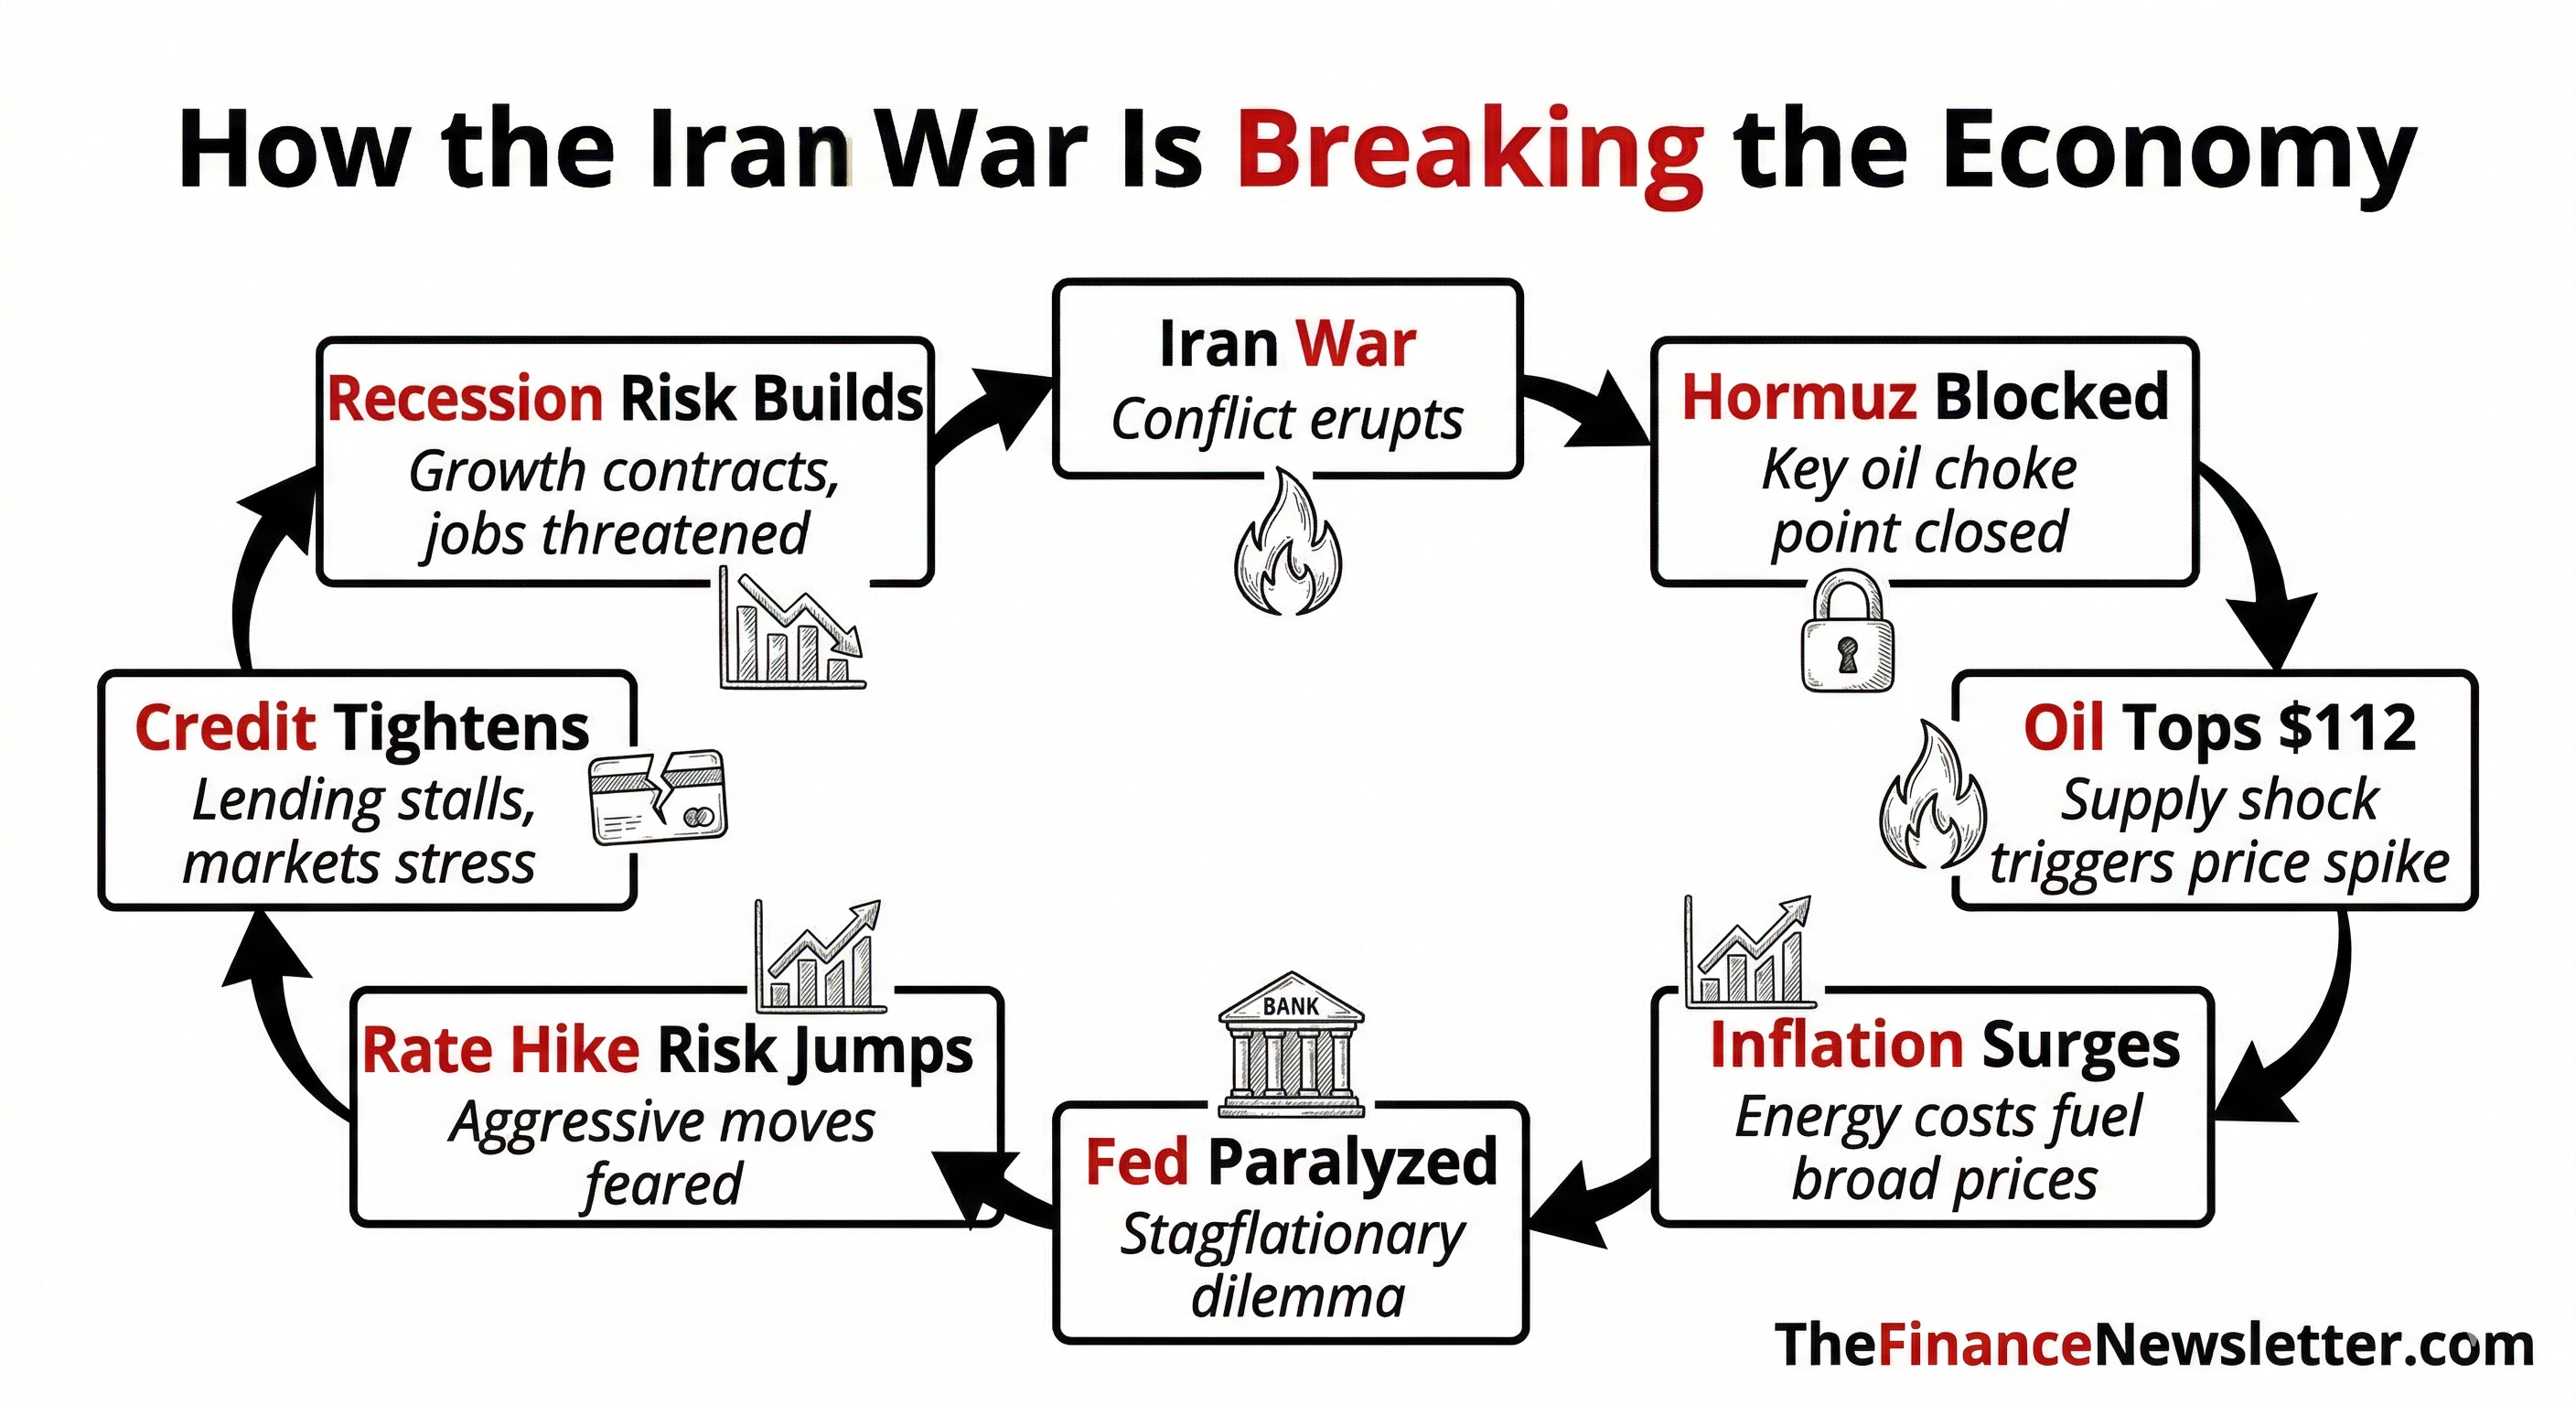
Every big market break starts the same way. One problem shows up. Then it spreads.
A war hits oil. Oil hits inflation. Inflation traps the Fed. Higher rates hit borrowers. Weak borrowers expose bad lending. Then people wake up and call it a recession.
That is the real story right now.
A lot of people still think this is just another bad news week.
It is not.
This is what it looks like when a geopolitical shock turns into an economic shock, then starts leaking into markets, rates, housing, and credit. The danger is not just oil at $100 plus. The danger is what high oil does next.
It raises costs. It revives inflation. It freezes central banks. It pressures weak balance sheets. It reveals what was fragile all along.
In this issue, I'm breaking down exactly what's happening, why it matters, and what you should do about it. I’ll show you how the Iran War just became an economic world war, why oil may stay high for years, why recession fears just hit 48%, and the private credit cracks that echo 2008
This issue will analyze how the Iran war triggered a global oil supply shock that is pushing inflation back to 4%, paralyzing the Federal Reserve, and cracking the $1.8 trillion private credit market (the same cracks that broke the economy in 2008), while revealing exactly which assets thrived during the 1970s stagflation and which are collapsing right now.
📬 In today’s issue:
Part I - Markets & Economy:
1. Macro Update & Analysis
2. Important News & Events
3. Chart of the DayPart II - Investing:
4. Insider Trades
5. Top Stocks Right Now
6. Today’s Trade
7. Fear & Greed Analysis
8. Technical & Macro-Economic AnalysisPart III - My Tips & Advice:
9. Actionable Advice & Recommendations
10. Final Thoughts & Lessons
11. Questions from Subscribers Answered
This newsletter takes a week to research & write so please help me and:
Hit the LIKE button❤️ on this post and share this newsletter with friends and family:
🙏Become a paid subscriber and get smarter with your money! (learn about the benefits here) (Get a free 30-day trial with this link):
(1) Market & Economy Update
📈 Everything Important You Need to Know (in 1 minute):
Recession fears are rising fast. Moody’s Analytics puts the odds at 48.6%, Wilmington Trust at 45%, and Goldman Sachs at 30%.
The OECD projected this week that U.S. inflation could hit 4.2% this year, up from 2.6% last year. That’d make America the highest-inflation G7 nation.
The S&P 500 logged its fourth straight weekly loss. Goldman Sachs laid out two warning scenarios: the S&P 500 drops to 6,300 (moderate case) or 5,400 (bear market, ~23% below the recent peak).
Fund managers are hoarding cash at the fastest pace since Covid. Allocations jumped from a record-low 3.2% in January to 4.3% in March.
Investor sentiment collapsed. Growth optimism fell from ~40% to just 7%. Inflation fears surged from 9% to 45%.
The financial sector ($XLF) is down 13.3% from its January 6 peak and approaching a “death cross” technical warning signal.
Meta began laying off hundreds of workers this week, cutting across Reality Labs, recruiting, and sales teams. CEO Mark Zuckerberg is doubling down on AI.
The Iran war blocked the Strait of Hormuz and pushed oil above $100/barrel. U.S. gas prices jumped ~27% in four weeks to $3.91/gallon, adding roughly $740/year in extra fuel costs for the average household.
💡 Andrew’s Analysis & Advice:
I’ve spent 20 years in finance, and one thing I know for certain: every crisis looks unsurvivable from the inside. The 2008 crash. Covid. The 2022 inflation shock. Each one felt like “this time is different.” Each time, the investors who stayed calm came out ahead.
So let’s talk about what’s really happening and, more importantly, what you should do.
The Iran War Is the Root Cause of Everything
The Strait of Hormuz isn’t just a stretch of water. It’s the artery of the global economy. About 20% of the world’s oil flows through it. Iran has largely shut it down.
The chain reaction is brutal. Oil tops $100/barrel. Gas prices jump. Airlines cancel flights. Shipping costs spike. Consumer goods get more expensive. Inflation, which the Fed had been close to taming, flares back up.
In just four weeks, gas went from $2.92 to $3.91 per gallon. For the average household, Stanford economists estimate that adds roughly $740 in extra fuel costs this year. And here’s what makes it worse: this supply shock is outside the Fed’s control. The Fed can raise or cut rates. It can’t reopen shipping lanes.
Fear Creates Discounts.
Here’s what the smart money knows and what most people miss.
Wall Street is scared. Fund managers are hoarding cash. Sentiment is near its lowest point in a year. But the investors who built real wealth didn’t do it during calm markets. They did it during moments like this one.
Two data points tell a more balanced story right now.
First, both JPMorgan and Morgan Stanley believe this correction may have already run its course. They argue that oil shocks that end bull markets historically exceed 100% year-over-year. The current move is closer to 40%. The panic may be arriving before the actual damage does.
Second, Goldman Sachs still holds a 7,600 year-end target for the S&P 500, expecting AI spending and softer growth to support markets. Goldman also keeps two risk scenarios in play: 6,300 on the moderate side and 5,400 in a bear case. Both are worth knowing.
The market’s internals reflect this split. Right now, 57 S&P 500 stocks are up at least 20% year-to-date while 47 are down the same amount, yet the index itself is only off about 3%. That’s not a market in freefall. That’s a market in transition.
The Stagflation Playbook: What History Actually Shows
Most people hear “stagflation” and picture the 1970s. Slow growth. High inflation. Decimated portfolios.
But here’s what most people get wrong: not everything struggled.
From 1973 to 1982:
Small-cap stocks beat inflation by 5.9% per year. While the “Nifty Fifty” large caps imploded, smaller companies kept delivering.
Housing beat inflation by 5.5% per year. Price gains plus rental income made real estate one of the decade’s best assets.
Gold? Just 3.4% above inflation per year. Everyone defaults to gold in a crisis. But Duke University finance professor Campbell Harvey’s research found that gold only reliably hedges inflation over periods of 100 years or more. Not 5 years. Not 10. A century.
This changes how you should think about your portfolio right now.
What Goldman and JPMorgan Are Telling Their Clients
Goldman Sachs is steering clients toward cybersecurity and green energy stocks, arguing that geopolitical risk and the AI boom create durable growth tailwinds for both sectors regardless of what happens with oil.
JPMorgan says use this dip to add capital goods, semiconductors, and cyclical stocks. They also favor eurozone and emerging-market stocks as buying opportunities once tensions ease.
But both banks agree on one thing: the financial sector looks vulnerable. The $XLF ETF is down 13.3% and approaching a “death cross.” Financials carry 12.5% of the S&P 500’s weight. If they roll over further, the broader market follows.
The SpaceX Wild Card
Amid all the fear and uncertainty, one story stands out for its long-term significance.
SpaceX is preparing for what could be the largest IPO in history: a $75 billion raise at a $1.75 trillion valuation. The company generated $16 billion in revenue and $7.5 billion in EBITDA last year with profit margins near 50%. It handled over half of all global orbital launches.
The announcement ignited the entire space sector this week. Rocket Lab surged ~10%. Firefly Aerospace jumped ~16%. Intuitive Machines gained nearly 15%. This is a long-term trend worth positioning for regardless of short-term market noise.
My advice:
Don’t flee to gold. History says it disappoints in stagflation.
Consider small-cap stocks and real estate. The 1970s show these outperformed during the last stagflation cycle.
Energy stocks and domestic LNG producers benefit from the crisis, not despite it.
Watch $XLF. If financials break down further, the broader market follows.
Keep cash ready. Not because the market is crashing, but because discounts are appearing.
Think about your variable-rate debt now, before rates potentially move higher.
Goldman still sees 7,600 on the S&P by year-end. Don’t confuse short-term fear with long-term destruction.
👉 To get smarter with money follow me on X /Twitter; Instagram Threads; Facebook; or BlueSky (and turn on notifications)
(2) Important News & Events
📬 In this issue we analyze:
1) The Iran War Is Becoming an Economic World War
2) Oil Prices May Stay High for Years
3) Interest Rate Hike Odds Jumped From 0% to 26%
4) Private Credit Is Showing the Same Cracks That Broke the Economy in 2008
🤔 But first, what worries you most right now?
1️⃣ The Iran War Is Becoming an Economic World War
Most wars are fought with bullets. This one is being fought with oil barrels.
Countries across South Asia are implementing emergency measures just to keep their economies running. Bangladesh closed universities. Pakistan shut down schools and mandated four-day workweeks. Sri Lanka did the same. Thailand pushed remote work. Parts of the Philippines ordered government employees to a four-day week. South Korea capped gas prices for the first time in nearly three decades.
This is what a global supply shock looks like in real time.
The math is simple and brutal. Twenty percent of the world’s oil and energy products flow through the Strait of Hormuz. Iran blocked that lane. When supply drops and demand doesn’t, prices rise and shortages follow.
And it’s not just oil. Diesel, jet fuel, and liquefied petroleum gas (used for heating and cooking) all travel through the same chokepoint. This disruption isn’t limited to the morning commute. It’s hitting factories, farms, hospitals, and homes.
The numbers are staggering. By the end of last week, JPMorgan’s commodities analysts estimated crude supply cuts were approaching 12 million barrels per day, creating a visible deficit across physical markets. The only resolution, they wrote, is a “comparable reduction in consumption.”
For context, Asia received more than 80% of the oil and petroleum products that moved through the strait in 2024. These economies aren’t adjusting to a price increase. They’re managing a genuine shortage.
The Wall Street Journal reported that lesser-known oil grades are already reflecting the crisis. Emirati oil hit $160/barrel. Norwegian, Russian, and Colombian crude are being bid up by Asian traders desperate for supply alternatives.
Japan launched its largest-ever oil reserve release this week. The EU is now considering gas price caps. Every major economy is improvising.
The bigger picture? U.S. liquefied natural gas exporters are positioned to be the big winners here. As Asian and European buyers scramble for non-Gulf supply, American LNG producers are seeing demand surge. This is one of the few sectors where the crisis creates genuine upside for U.S. investors.
China is worth watching too. It holds massive oil reserves and can shift some industrial production to coal. High oil prices accelerate China’s renewable build-out. Long-term, this conflict may strengthen China’s competitive position.
Philippines President Ferdinand Marcos Jr. put it plainly this week: “We are victims of a war that is not of our choosing.”
This isn’t only a risk event. It’s a massive shift in global energy trade flows, and some companies are positioned to benefit.
Long-term implication:
Energy-dependent businesses will bleed cash. Energy producers will print money. Rotate accordingly. I predicted this shift last month when oil first broke $90. If you listened, you’re up 20%+ on energy positions already.
2️⃣ Oil Prices May Stay High for Years
If you thought the energy crisis had peaked, this week changed that.
Brent crude closed at $112.19/barrel Friday, up for a fifth straight week. After Israeli forces struck Iran’s South Pars gas field (the largest in the world) earlier this week, Iran retaliated by hitting the Ras Laffan energy complex in Qatar. Saudi Arabia and Abu Dhabi also reported strikes on energy facilities.
Jet fuel hit $200/barrel in Asia and nearly $239/barrel in northwest Europe. Pre-war jet fuel was $85 to $90/barrel. That’s more than doubled in under four weeks.
United Airlines CEO Scott Kirby warned his team this week that jet fuel costs have more than doubled, adding a potential $11 billion in annual expenses. His internal planning scenario assumes oil reaches $175/barrel before retreating below $100 in late 2027. Delta flagged an additional $400 million in fuel costs through March alone. Transportation stocks tracked by Bank of America have dropped an average of 12% since the war began.
The knock-on effects are spreading fast. Average U.S. gas prices hit $3.91/gallon, up $0.98 from a month ago. Saudi Arabian officials warned this week that crude could climb to $180/barrel if fighting around the Strait of Hormuz continues into April.
The knock-on effects go beyond the pump. Higher fuel costs raise airfares and shipping prices, which push up the cost of virtually every good that moves through the supply chain.
Here’s the hard truth: monetary policy cannot fix a supply problem. The Fed can raise rates to slow demand. It can cut rates to stimulate borrowing. But it cannot build new oil wells or reopen shipping lanes. That reality is what makes this moment uniquely dangerous for markets.
The Bank of England shifted to a hawkish tone this week. The European Central Bank warned of a “significantly more uncertain” outlook. Both central banks are acknowledging the same thing: inflation may be about to get harder to fight, not easier.
Here’s the contrarian take worth holding onto, though. Morgan Stanley’s Mike Wilson pointed out this week that oil spikes that typically end bull markets exceed 100% year-over-year. The current move is closer to 40%. The panic may be arriving before the actual damage does.
My advice: Consider trimming airline and transportation exposure until there’s a clear path to lower oil prices. On the flip side, U.S. energy producers and domestic LNG exporters are worth watching as potential beneficiaries of this shift.
3️⃣ Interest Rate Hike Odds Jumped From 0% to 26%
For two years, every Fed conversation was about when the cuts were coming. This week, for the first time, the question shifted to whether hikes are next.
The Federal Reserve voted 11-1 to hold interest rates at 3.5%-3.75% for the second straight meeting. What wasn’t expected? The CME FedWatch tool now puts 26% odds on a rate hike by year-end. A week ago that number was zero.
Two-year Treasury yields are at 3.9%, above the current Fed target range. That pricing only makes sense if investors believe higher rates are coming.
Fed Chair Jerome Powell delivered what was, in my 20+ years in finance, one of the more candid admissions of uncertainty I’ve seen from a Fed Chair. He acknowledged that higher energy prices will push inflation up in the near term, but said the scope and duration remain unclear. When pressed on hikes, Chicago Fed President Austan Goolsbee told CNBC on Wednesday: “I could see circumstances where we would need to raise rates if inflation was getting out of control.”
Here’s why this matters for you.
The Fed raised its median inflation forecast to 2.7% for this year. Core inflation was also revised up. The Producer Price Index came in at 3.4% annually in February, the highest spike since February 2015. It’s been five straight years of above-target inflation. The Fed’s credibility is on the line, and it can’t afford to look passive if this energy shock bleeds into broader price increases.
The Dot Plot still points to one cut this year and two in 2027. But those forecasts were built before the Iran war’s full effects showed up in the data.
Then there’s the leadership drama. Powell’s term expires May 15. Kevin Warsh has been nominated as his replacement. But Republican Senator Thom Tillis is blocking the confirmation until the DOJ ends its investigation into Powell. A federal judge quashed those DOJ subpoenas this Friday, calling them “blatantly pretextual.” The U.S. Attorney immediately pledged to appeal. The confirmation timeline is now murkier than ever.
The spring of 2008 comes to mind. Back then, the ECB raised rates twice amid rising energy prices and a slowing economy. Hindsight calls it a catastrophic error. It left Europe worst-positioned for the financial crisis that fall. The Fed faces a version of that same trap right now.
Translation: Monetary policy is paralyzed. And paralysis during stagflation means your cash loses value faster than bonds can protect it.
My advice: If you carry variable-rate debt, including mortgages, credit cards, or business loans, now is the time to review your exposure. Lock in fixed rates where you can. Watch short-term Treasury yields as a real-time indicator of where rates are heading. A 3.9% two-year yield is telling you something.
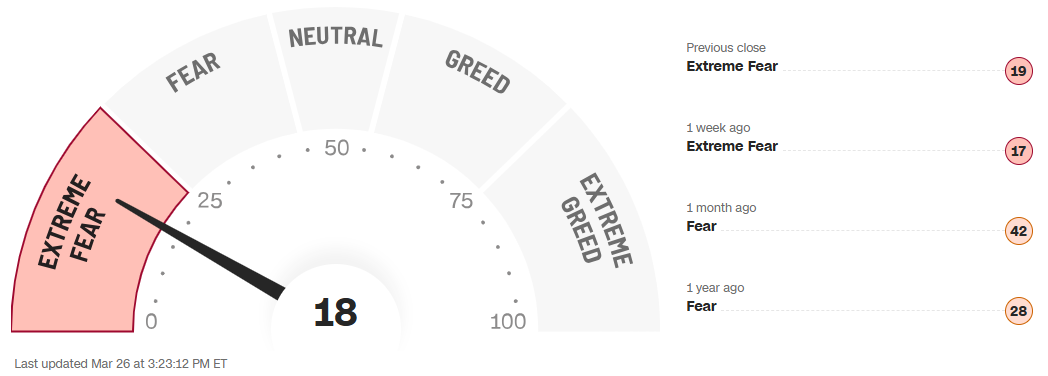
Keep 6-12 months of expenses in high-yield savings. Not stocks. Not bonds. Cash. Then deploy aggressively when the Fear & Greed Index breaks below 15. We're at 18 now. We're close.
4️⃣ Private Credit Is Showing the Same Cracks That Broke the Economy in 2008
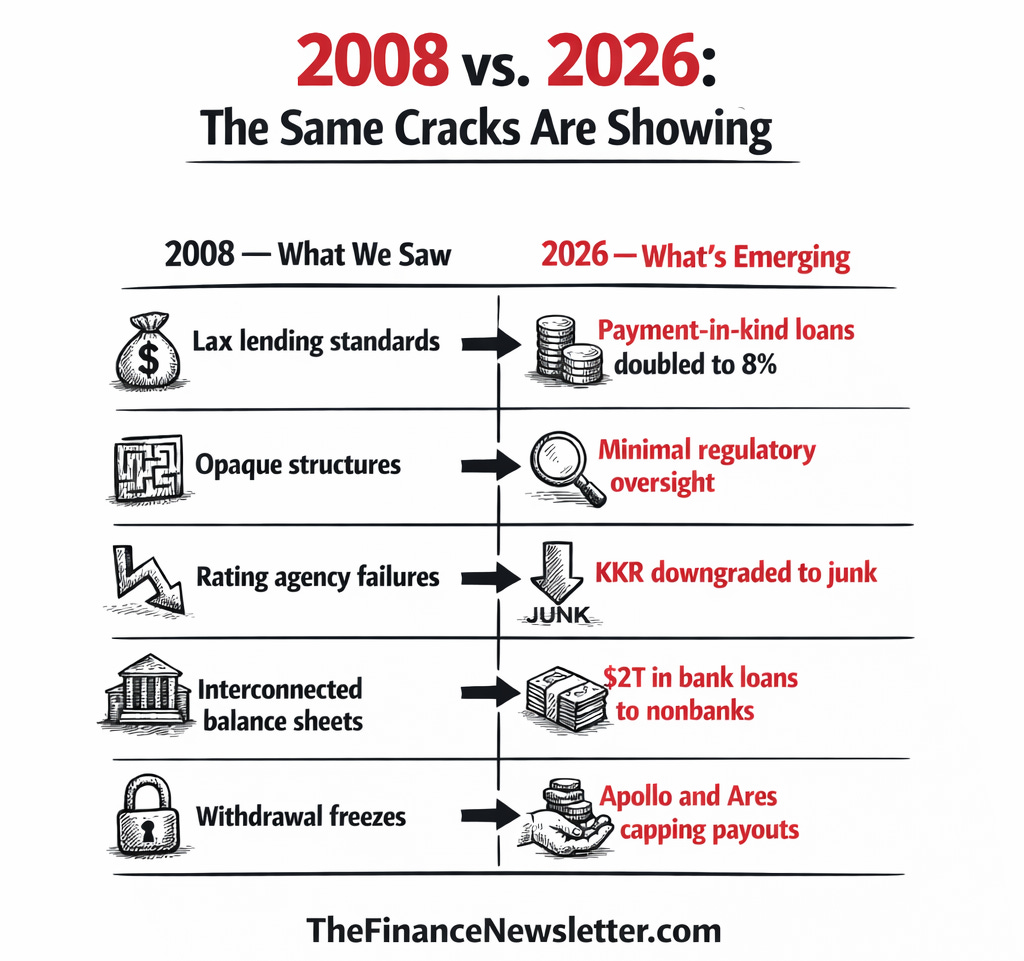
“The echoes of 2008 are becoming harder to ignore.”
That line came from Brian Judge, research director at UC Berkeley’s Program on Finance and Democracy. This week, those echoes got louder.
Private credit is a $1.8 trillion market, and two of its biggest players, Apollo Global Management and Ares Management, told investors this week they’re capping withdrawals. Investors requested to pull back more than 11% of fund shares. Both companies limited payouts to 5%, meaning investors received less than half of what they asked for.
Meanwhile, Moody’s downgraded a private credit fund run by KKR and Future Standard to junk status this week, citing deteriorating asset quality and a 5.5% non-performing loan rate.
Why should you care about a market most people have never heard of?
Because private credit is deeply connected to everything else. JPMorgan estimates 30% of private credit loans go to software companies, many of which face existential pressure from AI disrupting their business models. Goldman Sachs analysts estimate that in a worst-case scenario, private credit losses could hit $105 billion, cutting new private-sector lending by 5-6%.
The structural problem runs deeper. Unlike banks, private credit funds carry minimal regulatory oversight. Lax lending standards in recent years pushed “payment-in-kind” loans to 8% of the market, double the 2019 level. These are loans where borrowers roll unpaid interest onto their principal. The debt compounds. The problem stays hidden.
There’s also nearly $2 trillion in bank loans to nonbank lenders, up from $1.5 trillion just last year. Life insurance companies carry growing exposure. The interconnections are deeper than most realize.
DoubleLine CEO Jeffrey Gundlach warned this week that the current market environment resembles the period leading into 2008: muted performance masking deep vulnerabilities that only surface later.
Goldman Sachs takes a more measured view, noting private credit is only about 4% of total private-sector lending. A default spike to 3-4% would trim just 10 basis points from GDP. Not systemic, on paper.
But the pattern of events deserves attention: lax lending standards, opaque structures, rating agency inconsistencies, and banks holding exposure to the sector on both sides of the balance sheet. If this sounds familiar, it should.
My advice: If you have exposure to private credit funds, review your liquidity terms now. Know your redemption windows. The biggest risk here isn’t necessarily a 2008-style crisis. It’s being locked out of your own money when you need it most.
💡 Andrew’s Analysis & Advice:
The Iran war is squeezing energy supplies. That’s pushing inflation higher. That’s freezing the Fed. The Fed’s freeze is stressing borrowers. Stressed borrowers are defaulting on private credit loans. Tighter credit flows through to small businesses, consumers, and every “buy now, pay later” platform that runs on private funding.
Here’s my advice:
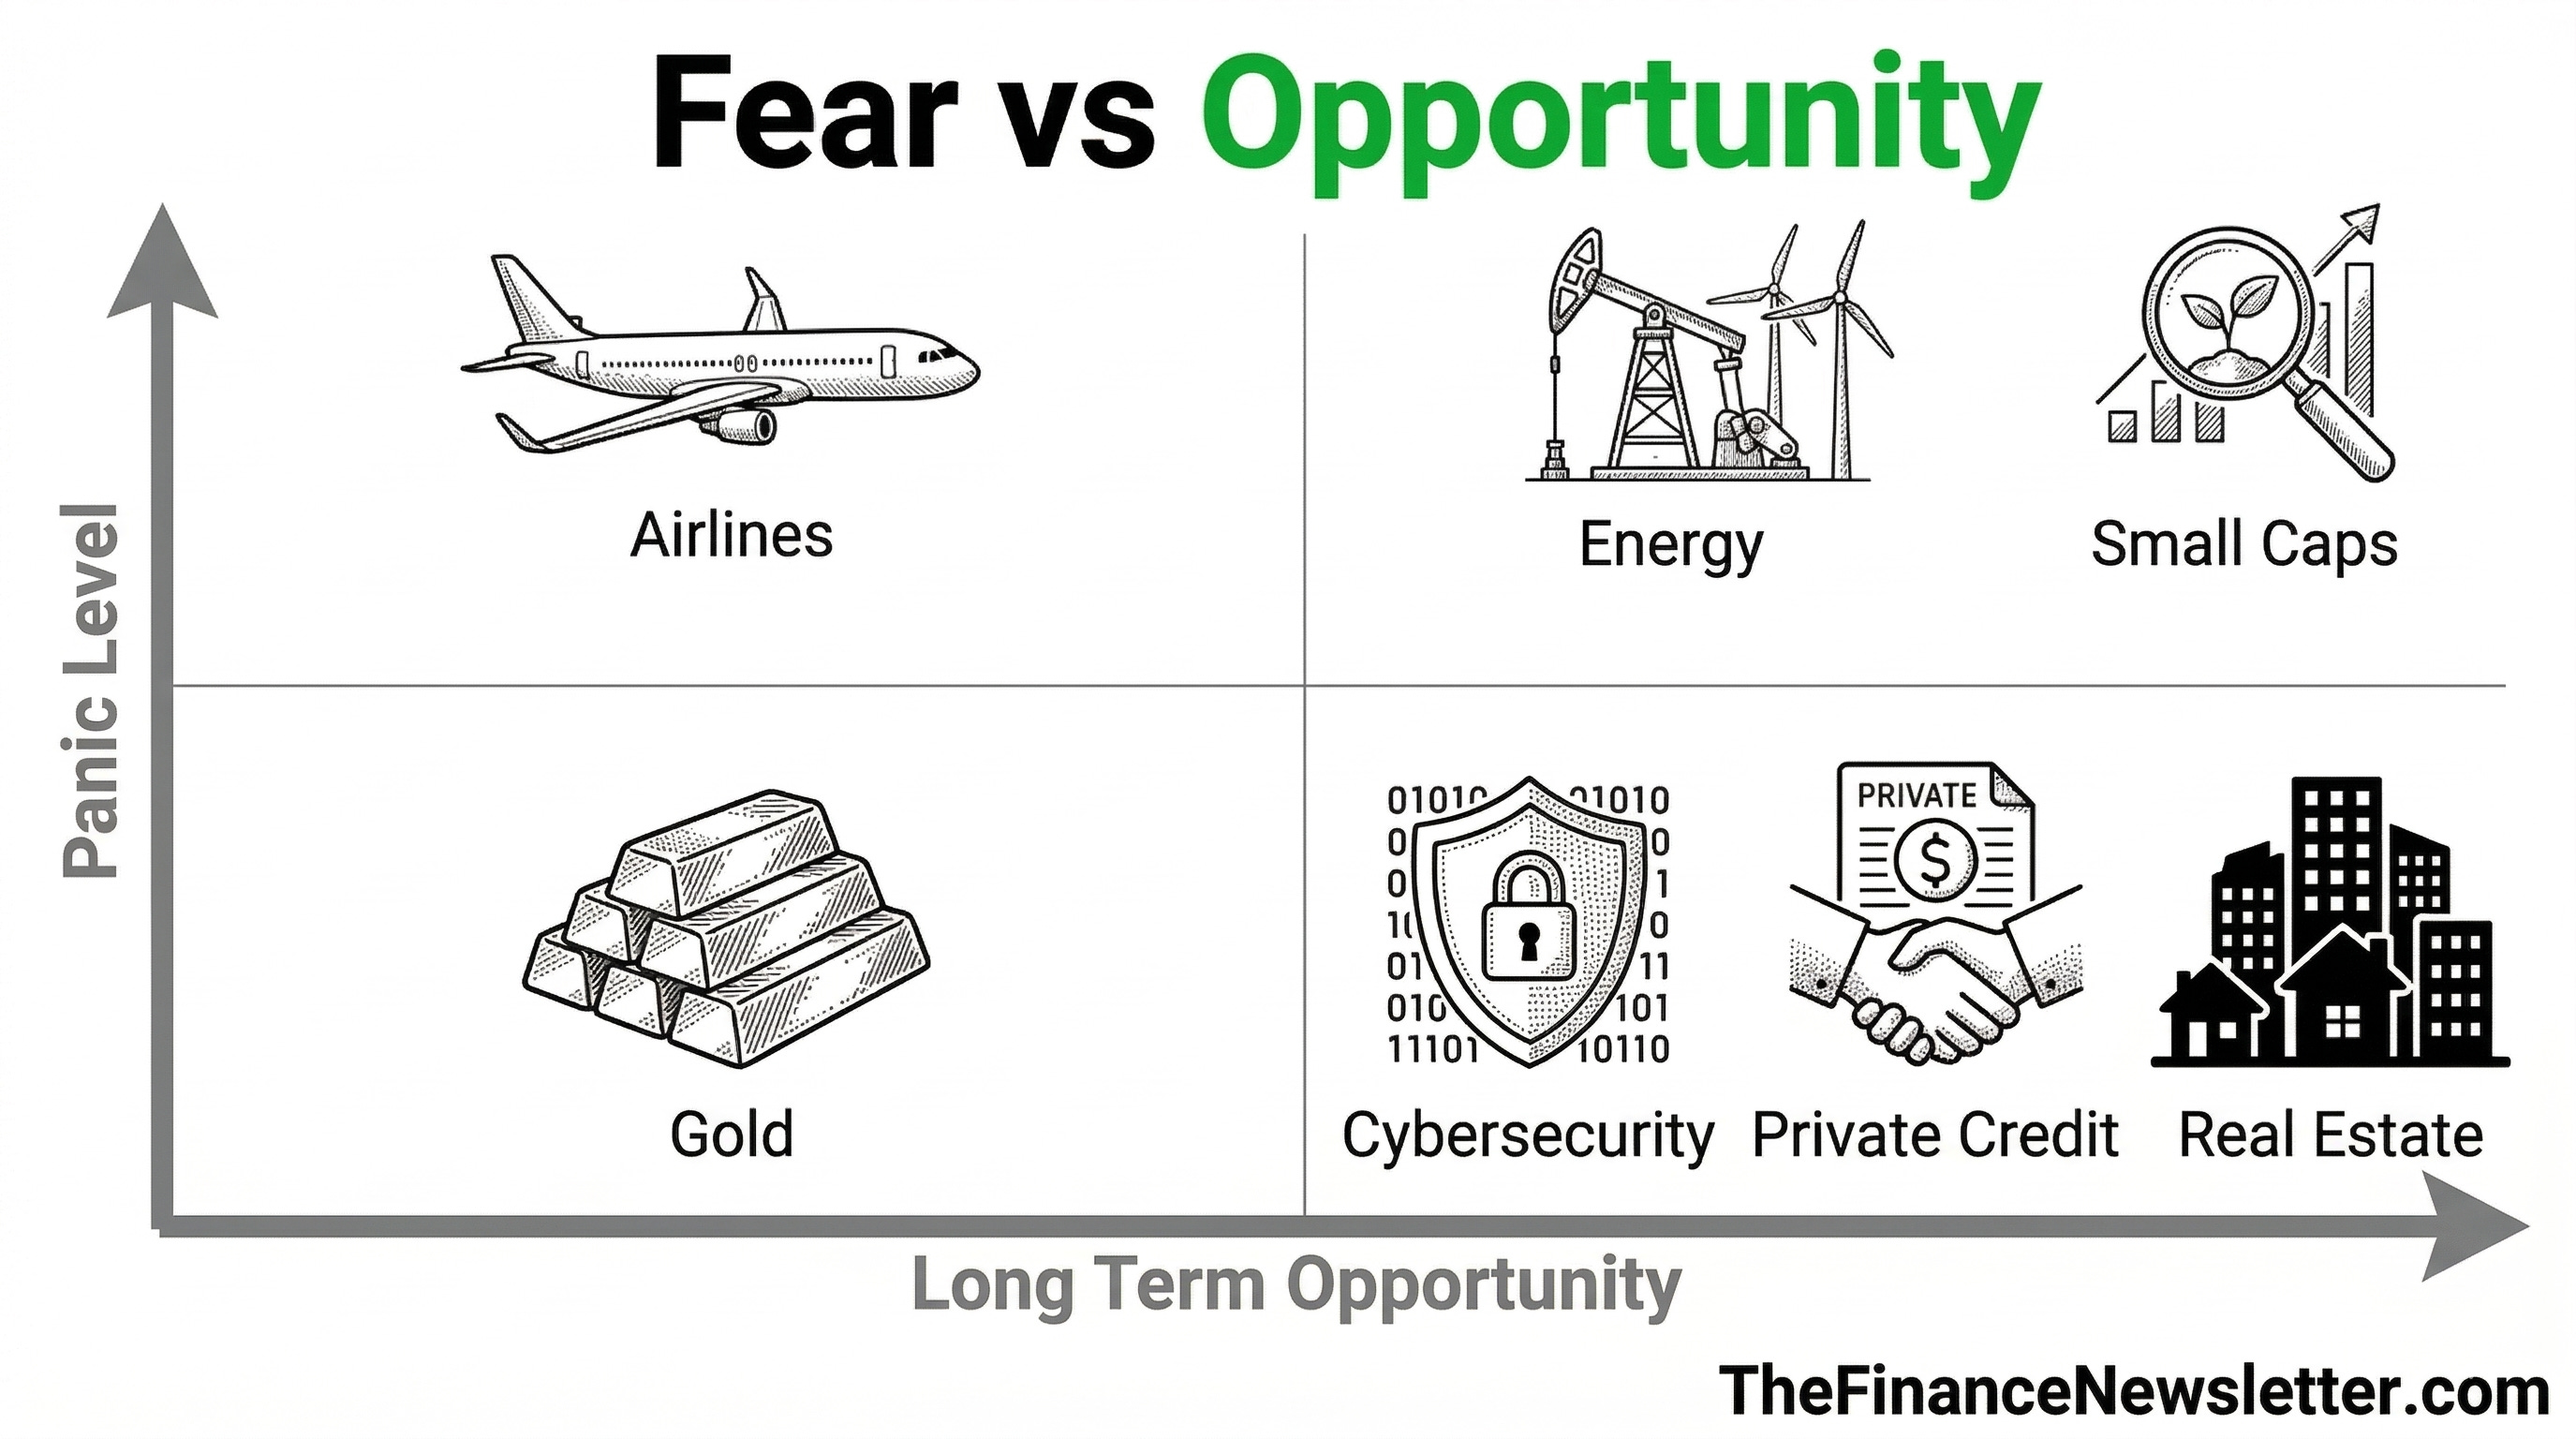
Offense: Energy stocks, domestic LNG producers, defense contractors, cybersecurity, and green energy. These sectors benefit from the current environment.
Defense: Short-term bonds (locking in 3.9% yields), income-producing real estate, and small-cap stocks with pricing power.
Avoid or reduce: Long-duration bonds (rate hike risk), airline stocks (fuel cost exposure), private credit fund positions (liquidity risk), and gold as a primary inflation hedge.
The investors who win in stagflation don’t freeze. They rotate.
👉 For daily insights, follow me on X/ Twitter; Instagram Threads; or BlueSky (and turn on notifications)
(3) Chart of the Day
Home Sellers vs. Buyers Hits a Record Gap (Why Nobody Can Sell Their Home)

💡 Andrew’s Analysis & Advice:
Take a look at this chart and let it sink in.
Home sellers now outnumber buyers by over 600,000. That’s not just a large gap. That’s the widest gap ever recorded, per Redfin data. As of early 2026, there are roughly 1.96 million active sellers and just 1.36 million active buyers in the U.S. housing market.
To understand why this matters, you need to go back to early 2020. When Covid hit, both buyers and sellers vanished from the market almost overnight. The red line (buyers) on the chart collapsed to historic lows.
Then something strange happened. Buyers came roaring back at record speed, fueled by rock-bottom mortgage rates and a pandemic-driven desire for more space. Demand exploded. Inventory was empty. Home prices skyrocketed.
Then rates rose. Buyers pulled back hard. But sellers kept listing. The gap between supply and demand widened month after month, and it hasn’t stopped.
Now layer in the current environment. The Iran war pushed mortgage rates higher for a fourth straight week. New home sales dropped 17.6% in January to 587,000 units, the lowest since October 2022. Median home prices fell 6.8% year-over-year to $400,500. New buyers now spend ~27% of their income on housing, near pre-2007 bubble levels. Existing homeowners pay just 20%. That 7-point gap is the widest in decades.
Here’s the counterintuitive insight most people miss.
Cutting mortgage rates won’t fix this. When rates drop, demand picks up, prices rise, and new buyers lose whatever they saved from the lower rate. EIG data shows this pattern clearly: even when rates fell from 2019 to 2021, monthly payments for new buyers still climbed. Lower rates mostly let existing homeowners refinance. New buyers still get squeezed.
The real fix is supply. More homes. Faster construction. Easier permitting. But those solutions take years, not months.
What this chart means for you:
If you’re an existing homeowner with a low locked-in rate, you’re sitting on one of the most envied financial positions in America right now. Your housing cost is fixed. Your home’s value is elevated. Hold it.
If you’re a first-time buyer, the playbook looks different. Consider house-hacking (buying a multi-unit property, living in one unit, renting the others to offset the mortgage). Look at markets where seller-to-buyer ratios are narrowing, not widening. Watch for motivated sellers in areas hit hardest by the current economic stress.
For investors, this chart is a signal. Rising inventory relative to demand typically leads to price compression in weaker markets. That creates buying opportunities. The 1970s showed that real estate beats inflation over time. But you need to be selective about where and when you buy.
The housing market is caught between affordability barriers on one side and a supply crisis on the other. That tension doesn’t resolve quickly. But patient, strategic investors have navigated it before.
This newsletter takes many hours to research and write so please help me and:
Hit the LIKE button on this post and share this newsletter with friends & family:
Become a paid subscriber and get smarter with your money! (learn about the benefits here) (Get a free 30-day trial with this link):
(Your job can pay for this newsletter with its employee development budget — Send this email template to your manager)
(4) Insider Trades (from Billionaires, Politicians, and CEOs):
When people with deep knowledge, such as politicians who set policy, executives who run the company, or legendary investors, put their own money on the line, pay attention.
1) Northern Trust Tax-Advantaged Ultra-Short Fixed Income Fund and Northern Trust Intermediate ETF
Representative Michael McCaul (R-TX) filed massive purchases of ultra-short fixed income funds and intermediate ETFs totaling over $2.5 million between February 10-18. When a senior congressman moves 80% of his disclosed activity into cash-equivalents yielding 4-5%, he is preparing for volatility.
McCaul sits on the House Foreign Affairs Committee, giving him unique insight into global stability trends. His committee role gives him access to Iran war briefings and geopolitical intelligence that the average investor doesn't have.
The direction of these trades is what stands out. Ultra-short-duration bond funds are a classic defensive move when you expect rising rates or economic uncertainty. They preserve capital, generate yield, and avoid the duration risk that hammers longer bonds when rates rise. The Northern Trust Intermediate ETF adds a bit more duration for a modestly higher yield while still staying conservative.
2) Sibanye Stillwater $SBSW
Filed March 20, 2026. Sibanye Stillwater is a global precious metals mining company, producing gold, platinum, palladium, and rhodium across operations in South Africa, the U.S., and Zimbabwe. CFO Charl Keyter filed a purchase of 148,819 shares at $11.63/share on March 20, totaling $1,730,765.
Nobody knows a mining company’s financial health better than its chief financial officer. When a CFO puts $1.7 million of their own money into the stock with their own money, they’re making a personal bet that the market is undervaluing the business.
The macro context strengthens the case. Gold and precious metals are seeing renewed investor interest as inflation fears surge. The Iran war is accelerating demand for hard assets across the board. Sibanye had been under pressure from operational issues and weak platinum group metals pricing. But a CFO buying at this scale suggests those concerns may already be priced in.
👉 For daily insights, follow me on X /Twitter; Instagram Threads; Facebook; or BlueSky, and turn on notifications!
(5) Top Stocks Right Now
1) Sarepta Therapeutics $SRPT - up +35% on Tuesday 2/25
Sarepta Therapeutics $SRPT surged +35% on Tuesday, February 25, making it one of the biggest single-day biotech moves of the year. Sarepta is a biopharmaceutical company focused on rare neuromuscular diseases, with a primary focus on Duchenne muscular dystrophy (DMD). The stock exploded after early clinical data from two new DMD drug candidates showed encouraging results. Drug trial data of this quality is a rare event, and the market priced in a significant pipeline upgrade almost immediately. Sarepta already has FDA-approved DMD treatments generating commercial revenue, making it a commercial-stage biotech with a growing pipeline behind it.
2) Planet Labs $PL - up +25.5% on Friday 3/20
Planet Labs $PL surged +25.5% on Friday, March 20, after reporting better-than-expected fourth-quarter results. Planet Labs operates a constellation of Earth-imaging satellites providing data analytics to governments, agriculture businesses, and defense clients worldwide. The SpaceX IPO news this week also provided a broad tailwind to the entire space sector, and Planet’s strong quarterly earnings gave it company-specific momentum on top of that. With demand for satellite imagery rising from defense agencies amid the Iran conflict, Planet is positioned in a growing market at exactly the right moment.
3) Apogee Therapeutics $APGE - up +20% on Monday 3/23
Apogee Therapeutics $APGE jumped +20% on Monday, March 23, after reporting positive Phase 2 results for its atopic dermatitis treatment. Atopic dermatitis (eczema) affects millions of Americans, and the competition in this space is fierce. Positive Phase 2 data is a major de-risking event for any biotech: it means the drug works in a controlled setting and has cleared one of the most significant clinical hurdles on the path to FDA approval. With a clear catalyst and a large addressable patient population, Apogee now sits on the radar of larger pharmaceutical companies as a potential acquisition target.
4) York Space Systems - up +19.2% on Friday 3/20
York Space Systems surged +19.2% on Friday, March 20, after reporting full-year revenue that beat analyst expectations. York builds small satellites and provides launch-integrated services for government and commercial customers. It’s part of the broader space infrastructure build-out that’s gaining momentum from both defense spending and commercial demand. The SpaceX IPO news lifted the entire sector this week, and York’s own strong revenue results added company-specific fuel to the fire.
5) Applied Optoelectronics $AAOI - up +19% on Monday 2/24
Applied Optoelectronics $AAOI surged +19% on Monday, February 24, after winning a new order for 800G data center transceivers from a major hyperscale customer. AAOI makes fiber-optic networking components essential for high-speed data center infrastructure. The 800G transceiver market is growing fast as data centers race to keep pace with AI workloads. When AAOI wins a hyperscale customer at this scale, it validates both the product and the broader demand trend. The announcement pulled optical peers Corning and Lumentum higher as well, as investors bet the entire component supply chain was in demand.
6) Arm Holdings $ARM - up +16.4% on Tuesday 2/25
Arm Holdings $ARM climbed +16.38% on Tuesday, February 25, after CEO Rene Haas projected that its new chip architecture could generate $15 billion in annual revenue by 2031. Arm doesn’t manufacture chips. It designs the underlying architectures that power virtually every smartphone, server, and AI chip on the planet. If Haas’s projection holds, it would represent a massive step up from Arm’s current revenue base. The market read that projection as confirmation of Arm’s central role in the AI chip boom. With AI hardware spending set to grow for years, Arm’s royalty-based business model makes it a pure-play beneficiary of the entire semiconductor wave.
7) SolarEdge Technologies $SEDG - up +13.2% on Friday 3/20
SolarEdge Technologies $SEDG climbed +13.2% on Friday, March 20, driven by a Jefferies analyst upgrade as Middle East tensions revived the energy security narrative. SolarEdge makes solar inverters and energy storage systems for residential and commercial solar installations. When oil hits $112/barrel, solar economics become far more compelling. SolarEdge had been under pressure from weaker European demand and inventory challenges, but the geopolitical tailwind changed the calculus for investors this week. Energy independence is a powerful theme right now.
8) Lumentum $LITE - up +10% on Monday 2/24
Lumentum $LITE gained +10% on Monday, February 24, riding the coattails of Applied Optoelectronics’ major hyperscale data center order. Lumentum is a leading maker of optical and photonic components used in telecom networks, data centers, and industrial applications. When a peer like AAOI wins a significant data center contract, it signals that the entire optical component supply chain is in demand. Lumentum’s own exposure to AI data center buildouts makes it a direct beneficiary of that same wave of infrastructure spending.
💡 Andrew’s Advice:
The stocks winning right now are either macro-immune (biotech), macro-tailwind beneficiaries (energy security, defense), or structural long-term plays (AI infrastructure). That's the framework for finding winners in a volatile market. You don't need the market to go up to make money. You just need to be in the right sectors.
👉 For daily insights, follow me on X /Twitter; Instagram Threads; Facebook; or BlueSky, and turn on notifications!
(6) Today’s Trade
The options market is where the smartest traders place their biggest bets. I monitor options flow activity daily.
Jefferies Financial Group $JEF - The 90-to-1 Bet
Unusual call activity hit furniture maker Jefferies this week with a call-to-put ratio of 90-to-1. This extreme bullish sentiment appeared after the financial services firm reported Q1 earnings Wednesday night.
Here is what happened in simple terms. A major trader bought 8,000 May 15th call options with a $45 strike price while simultaneously selling 8,000 May 15th calls with a $55 strike. This is called a bull call spread. They paid $1.24 per share (times 100 shares per contract, times 8,000 contracts) for a total outlay of roughly $992,000.
Their bet is simple. They believe Jefferies stock will close above $46.24 by May 15th (the break-even price). If it hits $55 or higher, they make $10 per share minus the $1.24 cost, for a potential profit of $7 million on a $1 million risk.
The Bullish Case
Reports surfaced last month that Japan’s SMFG (Sumitomo Mitsui Financial Group) is exploring a potential takeover of Jefferies. If that deal moves forward, $JEF’s stock could move significantly higher in a short window. Investment banks also tend to benefit from high-volatility environments: when markets are turbulent, trading revenues spike. Jefferies just reported Q1 earnings, and the stock’s positive reaction today suggests the results weren’t alarming. The trader may have read those earnings and liked what they saw, especially in the context of a potential acquisition.
My analysis:
Bullish on the setup, cautious on the timing. The 90:1 call ratio shows conviction. But M&A deals take months. This trade expires in 7 weeks. The trader is betting on accelerated negotiations.
👉 For daily insights, follow me on X /Twitter; Instagram Threads; Facebook; or BlueSky (and turn on notifications)
(7) Fear & Greed Sentiment Analysis
How do you cut through the noise and understand what’s really happening? The secret is to look at the feelings people, the actions of investors, and the facts about the economy.
This week’s Fear & Greed reading is deeply negative, and it’s telling you something important.
The Fear & Greed Index sits at 18 as of today, firmly in “Extreme Fear” territory. A month ago the reading was 42 (neutral). A week ago it was 17. It’s essentially flatlined at the bottom of the scale.
Readings this low are rare. You typically see them during genuine crises: the 2020 Covid crash, the 2022 inflation shock, the 2023 banking scare. The fact that we’re here again tells you everything about how investors are feeling right now.
Every single component of the index is flashing red.
Market Momentum is in extreme fear. The S&P 500 has broken below its 125-day moving average, meaning the index is trending below where it’s been for the past several months.
Stock Price Strength is in extreme fear. More NYSE stocks are hitting 52-week lows than highs right now, meaning the pain is broad-based, not concentrated in a few names.
Stock Price Breadth is in extreme fear. On the McClellan Volume Summation Index, the volume of declining stocks is swamping advancing ones. The entire market is selling.
Put and Call Options are in fear (not extreme, but notable). The 5-day average put-to-call ratio has risen, meaning investors are buying more protection against further drops.
Market Volatility is in fear. The VIX sits around 25, up nearly 19% from a month ago. Elevated volatility signals that markets expect more turbulence ahead.
Safe Haven Demand is in extreme fear. Bonds are outperforming stocks over the past 20 trading days. Investors are fleeing equities for Treasuries.
Junk Bond Demand is in extreme fear. The yield spread between junk bonds and investment-grade bonds is widening. Investors are demanding more compensation for credit risk, a classic risk-off signal.
What Does This Mean?
Historically, extreme fear readings are better buying signals than selling signals.
Warren Buffett built most of Berkshire Hathaway’s best positions during periods of maximum fear. His rule, “be greedy when others are fearful,” isn’t a cute quote. It’s a strategy backed by decades of results.
But timing that contrarian move requires discipline. Extreme fear can deepen before it reverses. The index was at 17 last week and 18 today. That’s not a rebound. That’s a floor being tested.
My advice: Fear readings below 20 have historically preceded strong 6-to-12-month returns in the stock market. That doesn’t mean the bottom is in today. It means the probability of strong forward returns from this level is historically higher than average.
How This Connects to Current Events
The Iran war is the single biggest driver of the fear reading right now. Oil above $112/barrel. Inflation fears resurgent. Rate hike odds rising to 26%. The Fed frozen. Private credit under stress. Each headline adds to the pile.
But fear creates opportunity. The investors who bought in March 2020 when the index was near zero made extraordinary returns over the following two years. The question isn’t whether the fear is justified. It is. The question is whether it’s already priced in.
My advice: A Fear & Greed reading of 18 doesn’t mean sell everything. For patient, long-term investors, it often means the opposite. This is the environment where wealth gets built, not lost, if you have the discipline to act when others are frozen.
👉 For daily insights, follow me on X /Twitter; Instagram Threads; Facebook; or BlueSky (and turn on notifications)
(8) Technical & Macro Analysis
Technical levels matter because they’re where millions of traders have programmed their buy and sell orders. When key levels break, algorithms kick in and magnify moves.
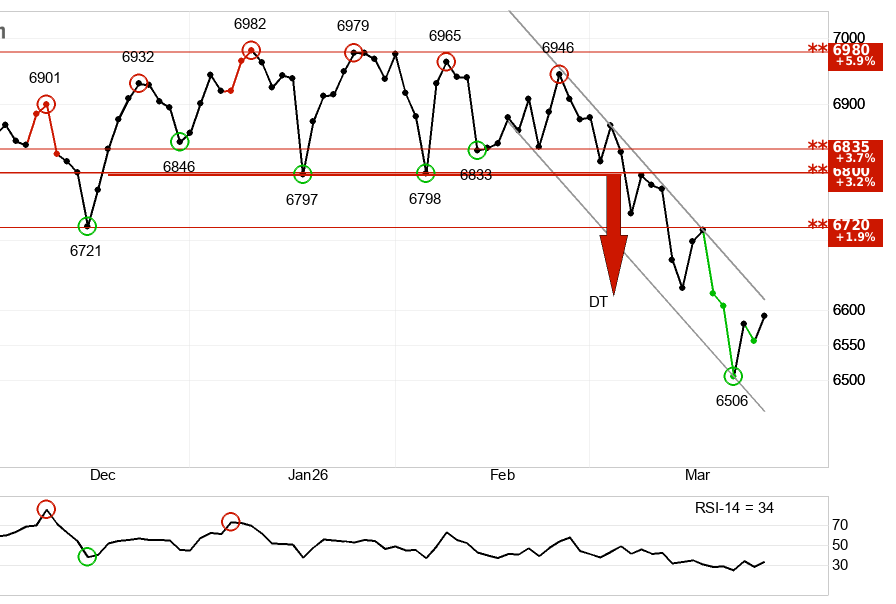
1) S&P 500 SPY 0.00%↑
This trend is negative in the near term.
The index is in a falling trend channel, which signals that investors are accepting lower prices to exit positions. A double top formation broke support at 6,797, triggering a downside target of 6,620. That target was met this week. But the formation signals continued pressure from here.
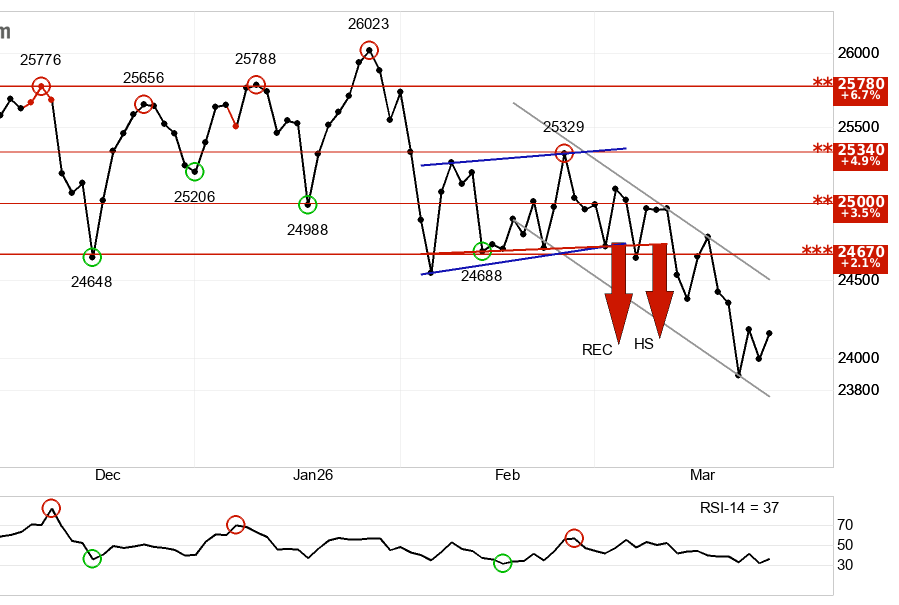
2) Tech Stocks QQQ 0.00%↑
This trend is negative in the near term.
The index completed a head and shoulders formation and hit its downside target at 24,126 this week. Head and shoulders formations are among the most reliable bearish signals in technical analysis. After meeting the target, the index bounced, but the formation implies further pressure ahead.
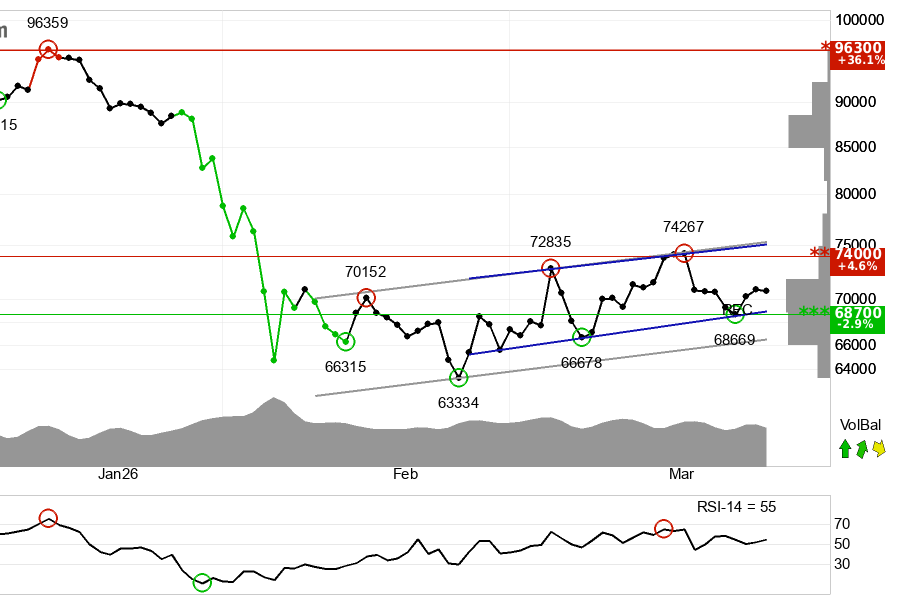
3) Bitcoin $BTC
This trend is positive in the near term.
Bitcoin is in a rising trend channel in the short term, trading within a rectangle formation between support at $68,977 and resistance at $75,148. A decisive break above $75,148 opens the door to a new leg higher. Volume balance is positive, which strengthens the trend. Key support sits at $68,700, resistance at $74,000 near-term.
Bitcoin is up 4.47% over the past 22 days, a sharp contrast to the S&P 500 and Nasdaq, which are both lower during that same window.
Why is Bitcoin holding up while stocks sell off? A few reasons. Some investors are treating it as a hedge against inflation and dollar debasement in a world where oil is surging and the Fed is frozen. Others are rotating into assets that sit outside the traditional equity and bond cycle. The halving cycle also provides a structural tailwind regardless of macro conditions.
4) Macro-Economic Analysis (How This Connects To Everything)
Let’s zoom out and connect the dots.
Both the S&P 500 and Nasdaq-100 are in short-term downtrends with bearish formations. Bitcoin is bucking that trend with a rising channel. Safe haven demand is elevated (bonds beating stocks). The VIX is at 25 and rising. The Fear & Greed Index is at 18. The financial sector is approaching a “death cross.”
These signals all tell the same story: the market is in a risk-off phase. Investors are reducing equity exposure, not adding to it.
The macro backdrop reinforces everything. The Iran war is fueling inflation fears. The Fed is on hold. Rate hike probability jumped to 26% this week. Private credit is under stress. The feedback loops are tightening.
But here’s the critical context that most people miss right now. Medium-term and long-term technical signals for both the S&P 500 and Nasdaq remain positive.
Short-term pain within a long-term uptrend is normal. It’s often exactly where wealth gets built.
My advice:
A Fear & Greed reading of 18, combined with a long-term positive technical structure, is a historically favorable setup for patient buyers. Use this fear-driven pullback to dollar-cost average into high-quality positions.
The market is telling a consistent story across every section of this newsletter: fear is high, the short-term is rough, but the long-term structure hasn’t broken. The investors who navigate this well are the ones who hold both truths at once.
This newsletter takes a week to research & write so please help me and:
Hit the LIKE button on this post & share this newsletter with friends and family:
Become a paid subscriber and get smarter with money! (learn about the benefits here) (Get a free 30-day trial with this link):
(9) My Actionable Advice & Recommendations:
Fear creates the best buying opportunities - The Fear & Greed Index at 18 has historically preceded strong 6-to-12-month returns. Warren Buffett’s rule isn’t a quote. It’s a strategy.
Consider energy, defense, and cybersecurity. Goldman recommends cybersecurity and green energy for geopolitical tailwinds. JPMorgan likes capital goods and semiconductors. Both favor U.S. LNG exporters as the energy crisis winners.
Small-cap stocks outperformed in the last stagflation - From 1973 to 1982, small-caps beat inflation by 5.9% per year while large-cap “Nifty Fifty” stocks imploded.
Watch the Financial Sector Death Cross. The XLF financial ETF is down 13.3% and approaching a death cross. Financials carry 12.5% of the S&P 500 weight. If banks break down further, the entire market follows. This is your early warning system.
Avoid airline and transportation stocks because surging jet fuel costs will destroy their profit margins.
👉 For daily insights, follow me on X /Twitter; Instagram Threads; Facebook; or BlueSky (and turn on notifications)
(10) My Final Thoughts & Lessons:
So here’s where we stand.
Right now, fund managers are hoarding cash. Sentiment is near its lowest point in a year. Recession odds are climbing. Private credit is showing cracks.
The Iran war is squeezing energy supplies. That’s pushing inflation higher. That’s freezing the Fed. The Fed’s paralysis is stressing borrowers. Stressed borrowers are defaulting on private credit loans.
It sounds catastrophic. And for some investors, it will be.
But in my 20 years in finance, I’ve seen this pattern before. Every crisis looks unsurvivable from the inside. The 2008 crash. Covid. The 2022 inflation shock. Each time, the investors who stayed calm and rotated strategically came out ahead.
The playbook is clear. Energy stocks, domestic LNG producers, and defense contractors benefit from this environment. Short-term bonds lock in 3.9% yields. Small-cap stocks with pricing power outperform.
What you shouldn’t do is panic. Fear readings below 20 have historically preceded strong 6-to-12-month returns. Goldman still sees 7,600 on the S&P 500 by year-end.
Private credit is showing the same cracks that preceded 2008. The Iran war is reshaping global energy trade. The Fed is paralyzed. And in the middle of all this fear, some of the same conditions that created extraordinary buying opportunities in the past are showing up again.
The investors who win in stagflation don’t freeze. They rotate.
Here’s what separates the wealthy from everyone else.
They don’t wait for certainty. Certainty never comes. They act on probability.
Right now, the probability favors the prepared. Energy stocks. Domestic LNG. Defense contractors. Cybersecurity. Small-cap value. Income-producing real estate.
Let me leave you with this.
Every major wealth transfer in history happened during periods like this. Uncertainty. Fear. Confusion.
The 2008 financial crisis. The 2020 pandemic crash. The 2022 inflation shock.
Each one felt unsurvivable from the inside. Each one created millionaires.
The difference wasn’t market conditions.
It was mindset.
👉 For daily insights, follow me on X /Twitter; Instagram Threads; Facebook; or BlueSky (and turn on notifications)
(11) Important Questions from Subscribers Answered
Have a question? Comment below and I will answer it in the next issue!!
Q: What is private credit, and why should I care about it?
Private credit is a $1.8 trillion market of loans made by non-bank lenders — firms like Apollo, Ares, and KKR — directly to businesses, bypassing traditional banks. Most investors have never heard of it. But it matters because it’s deeply connected to everything else. 30% of private credit loans flow to software companies already facing existential pressure from AI disruption. These funds carry minimal regulatory oversight. Lax lending standards pushed “payment-in-kind” loans to double their 2019 levels — these are loans where borrowers roll unpaid interest onto their principal, compounding hidden debt. This week, Apollo and Ares capped investor withdrawals. KKR got downgraded to junk. You may not own private credit directly, but your bank, your life insurer, and the small businesses in your community might.
Q: How high could oil actually go?
Saudi officials warned crude could hit $180/barrel if the Strait of Hormuz stays blocked through April. United Airlines is modeling $175/barrel before a retreat in 2027. If Iran strikes Saudi or UAE facilities, triple-digit oil becomes a multi-year reality, not a spike. Prepare your portfolio for $100+ oil as a baseline, not a peak.
‼️Have a question? Comment below and I’ll answer it in the next issue!!
👋Last Words:
🙌Thank you for reading and joining 112,000 subscribers who trust our newsletter to get smarter and richer! My goal is simple: Make it easy for you to connect the dots on the economy, markets, and investing.
Each newsletter takes a few hours to research & write so please help me and:
Hit the LIKE button❤️ on this post & share it with friends and family:
🙏Become a paid subscriber and get smarter with your money (learn about the benefits here) (get a free 30-day trial with this link):
(fyi, your job can pay for this newsletter with its employee development budget. To make it easy, we’ve created this email template to send to your manager.)
And please let us know what you think of this newsletter:
Missed an issue? Read past issues here at TheFinanceNewsletter.com
☺️ My goal is to help you become richer and smarter with money — Join 3+ million and follow me across social media for daily insights:
Instagram Threads: @Fluent.In.Finance
Twitter/ X: @FluentInFinance
Facebook Page: Facebook.com/FluentInFinance
Linkedin: Linkedin.com/in/Lokenauth
Youtube: Youtube.com/FluentInFinance
Instagram: @Fluent.In.Finance
TikTok: @FluentInFinance
Facebook Group: Facebook.com/Groups/FinanceTalk
Reddit Community: r/FluentInFinance
➕Please add this newsletter to your contacts to ensure that none of our emails ever go to spam!
This content is for educational purposes only. Such information should not be construed as legal, tax, investment, financial, or other advice. See for Disclaimer, Terms and Conditions.
This breakdown is exactly what people need right now. The way you connected the Strait of Hormuz to inflation to the Fed being paralyzed is so clear and honestly a little unsettling when you see it laid out like that.
The Fed’s biggest fear right now isn’t a recession. It’s a 1970s-style “stagflation expectations loop.” Once people expect prices to keep rising, they demand higher wages. Higher wages push prices higher. The loop becomes self-fulfilling. Breaking that loop later costs way more than stopping it now.